April 2023 update
New dashboard tables, financial models with configurable frequencies and aggregation, cross-sectional aggregation of signals across multiple companies, and improvements to the DSL and dashboard performance.
New features
New dashboard tables
We have refreshed the look and feel of dashboard tables, incorporating a lot of the feedback received over the past year. In particular, we've made tables more compact to show more data on more companies at once, addressing a pain point where very few companies were shown on smaller screens.
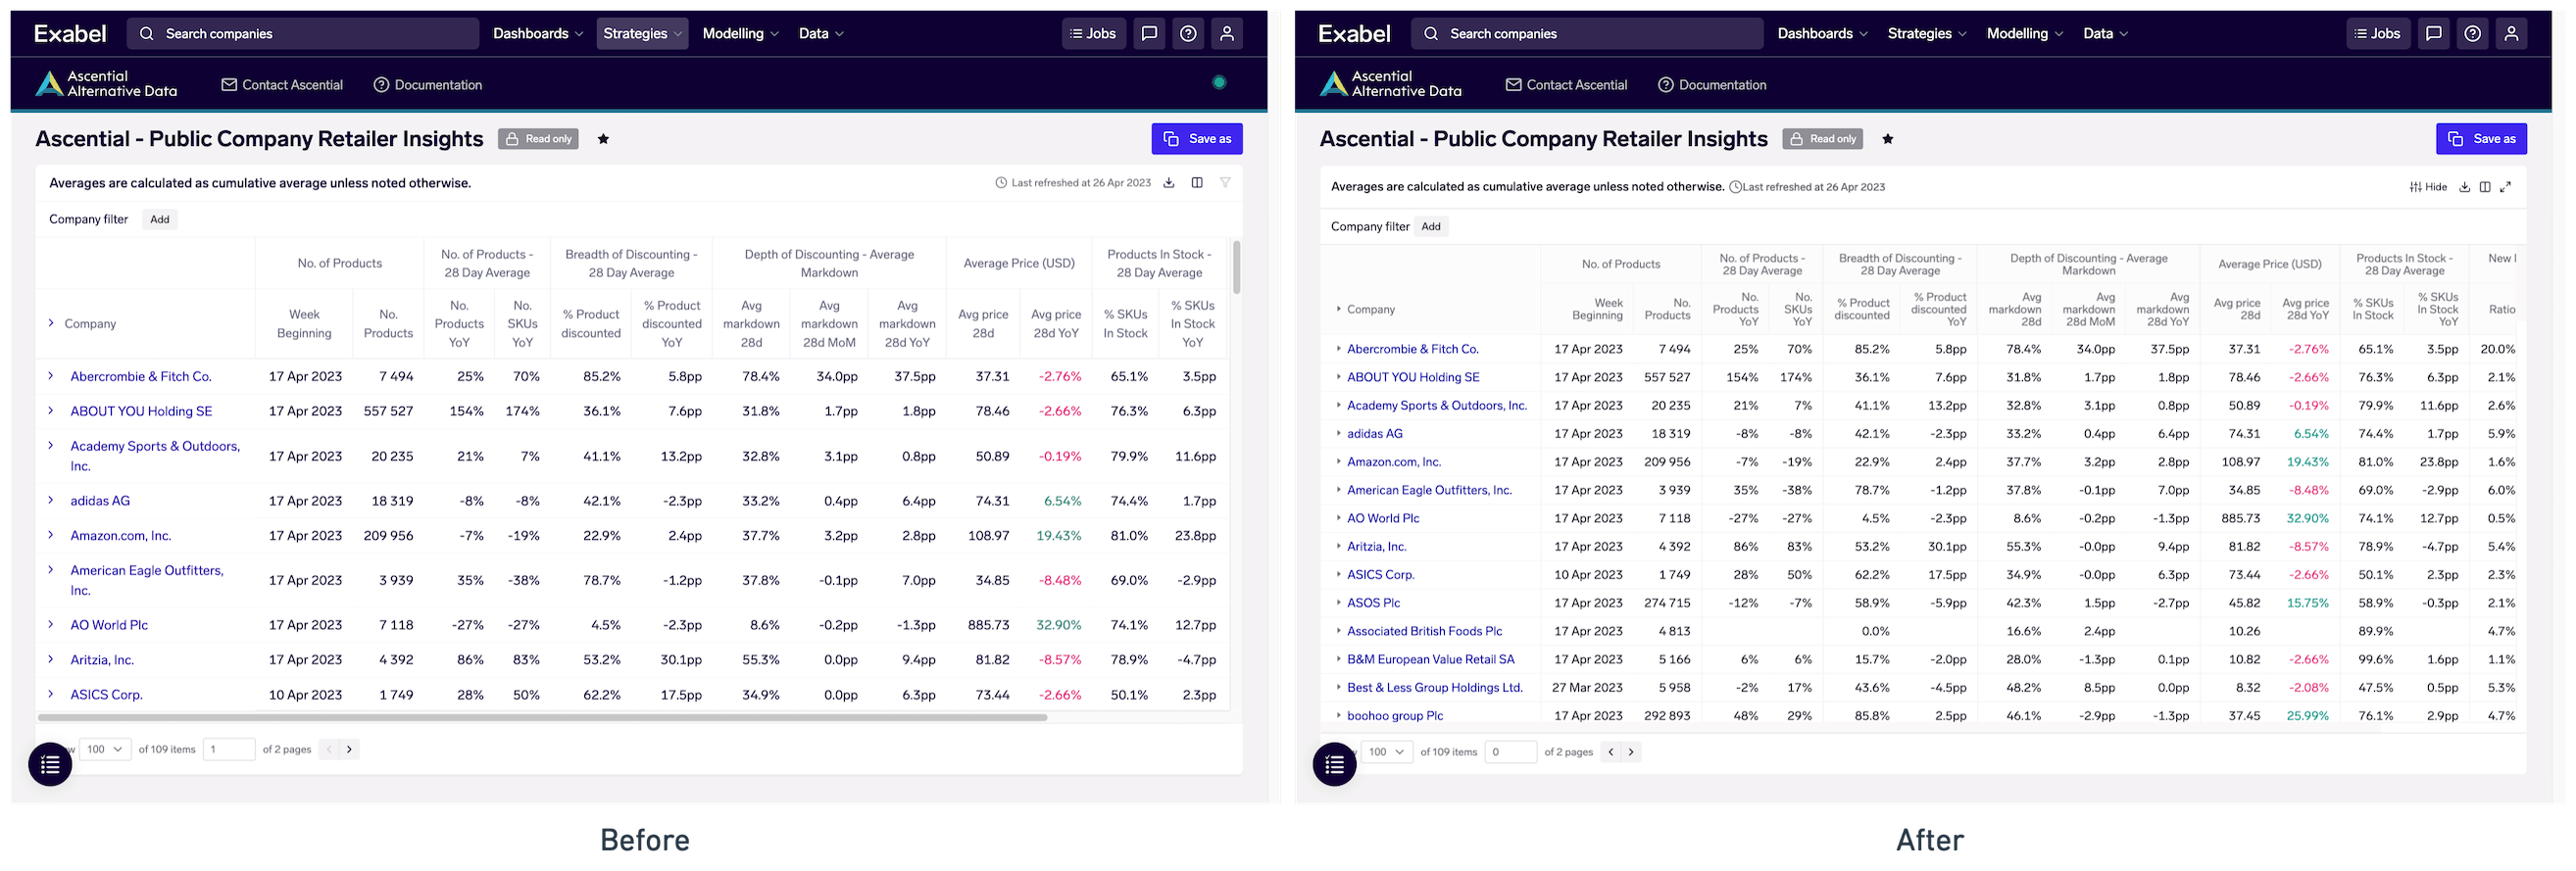
Ascential Insights Platform - view more metrics and more companies at the same time
Tables can now also be opened in fullscreen mode, allowing for maximum visibility when desired. Company and column filters are now also combined in a single filter toolbar.
Coming soon: linking tables to chart and financial model widgets, which will then allow you to select companies from a table and view them on accompanying charts & financial models.
Financial model frequencies and aggregation
Financial models can now be configured to show KPIs and alternative data on different frequencies - interims (quarterly/semi-annual), annuals, interims & annuals, calendar months and quarters. A financial model can have more than one frequency, allowing viewers to easily switch between a quarterly and annual view. Fiscal quarters / years (e.g. 4Q-2022, FY-2022) are now also displayed alongside the date.
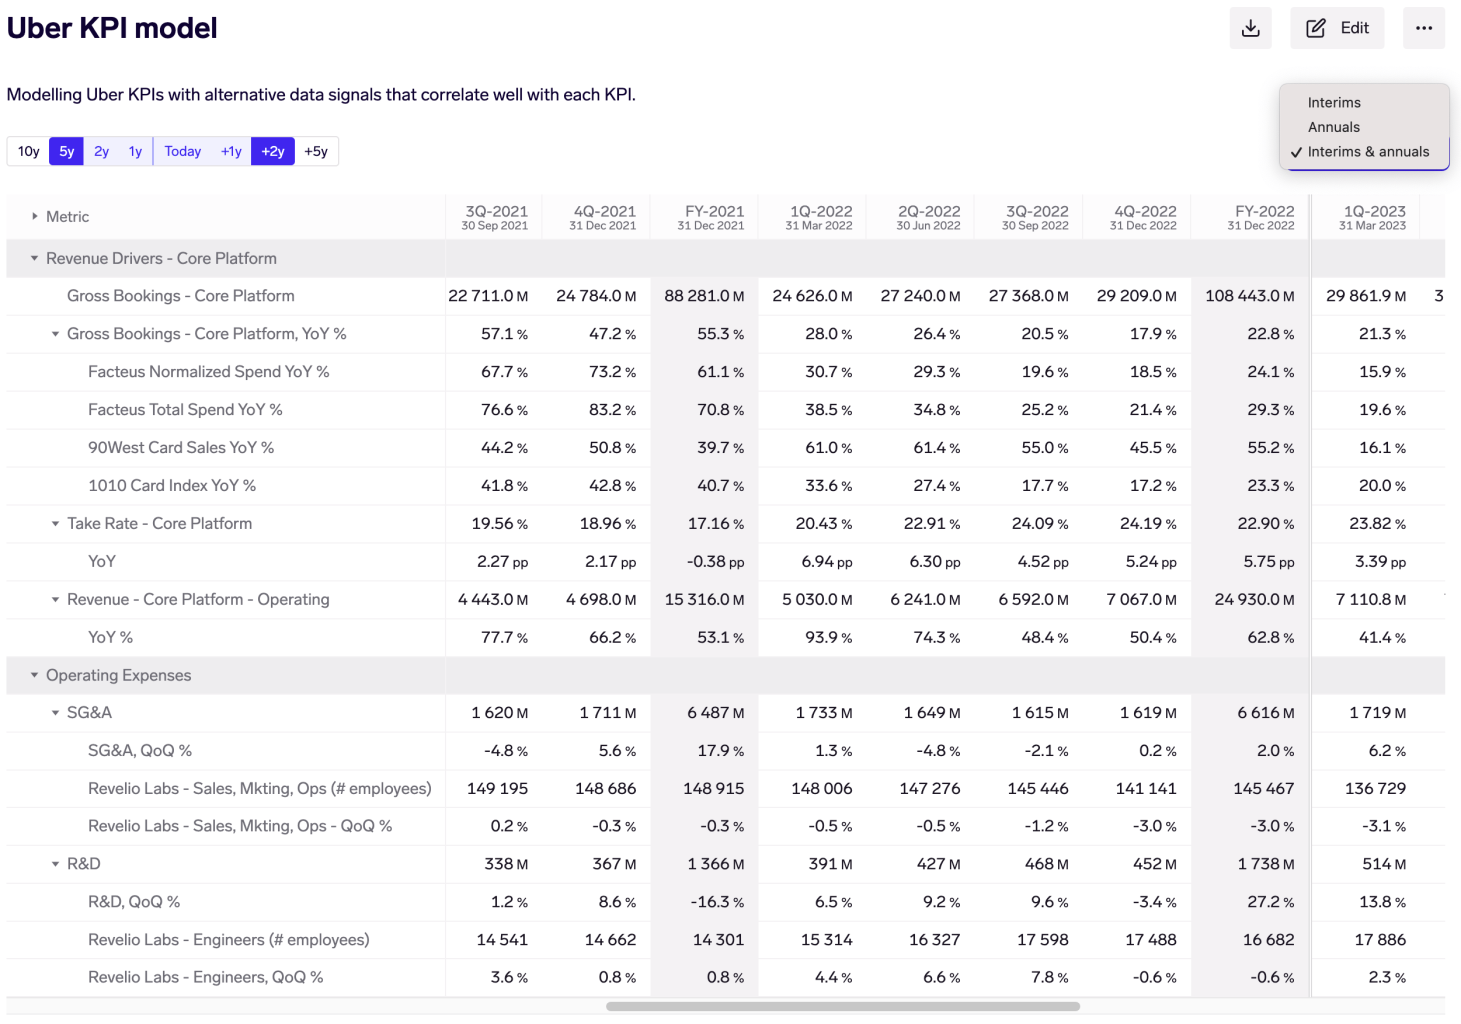
Financial model with Visible Alpha KPIs mapped against alternative data signals, with both interims and annuals shown simultaneously. High-frequency alternative data is.
We've also added options to let you easily handle high-frequency alternative data (e.g. daily credit card data) by aggregating to quarters/years, and applying sequential/YoY changes as desired. We then smartly aggregate it over the relevant quarter/year, depending on which company and periods are being shown.
Cross-sectional aggregation
In Signal Explorer and charts, you may now enable aggregate signals across your selected companies/entities. For example, if you have a signal for web traffic and have selected 5 web domains, you may now choose to plot the sum across all 5 domains, or calculate and plot market share and rank.
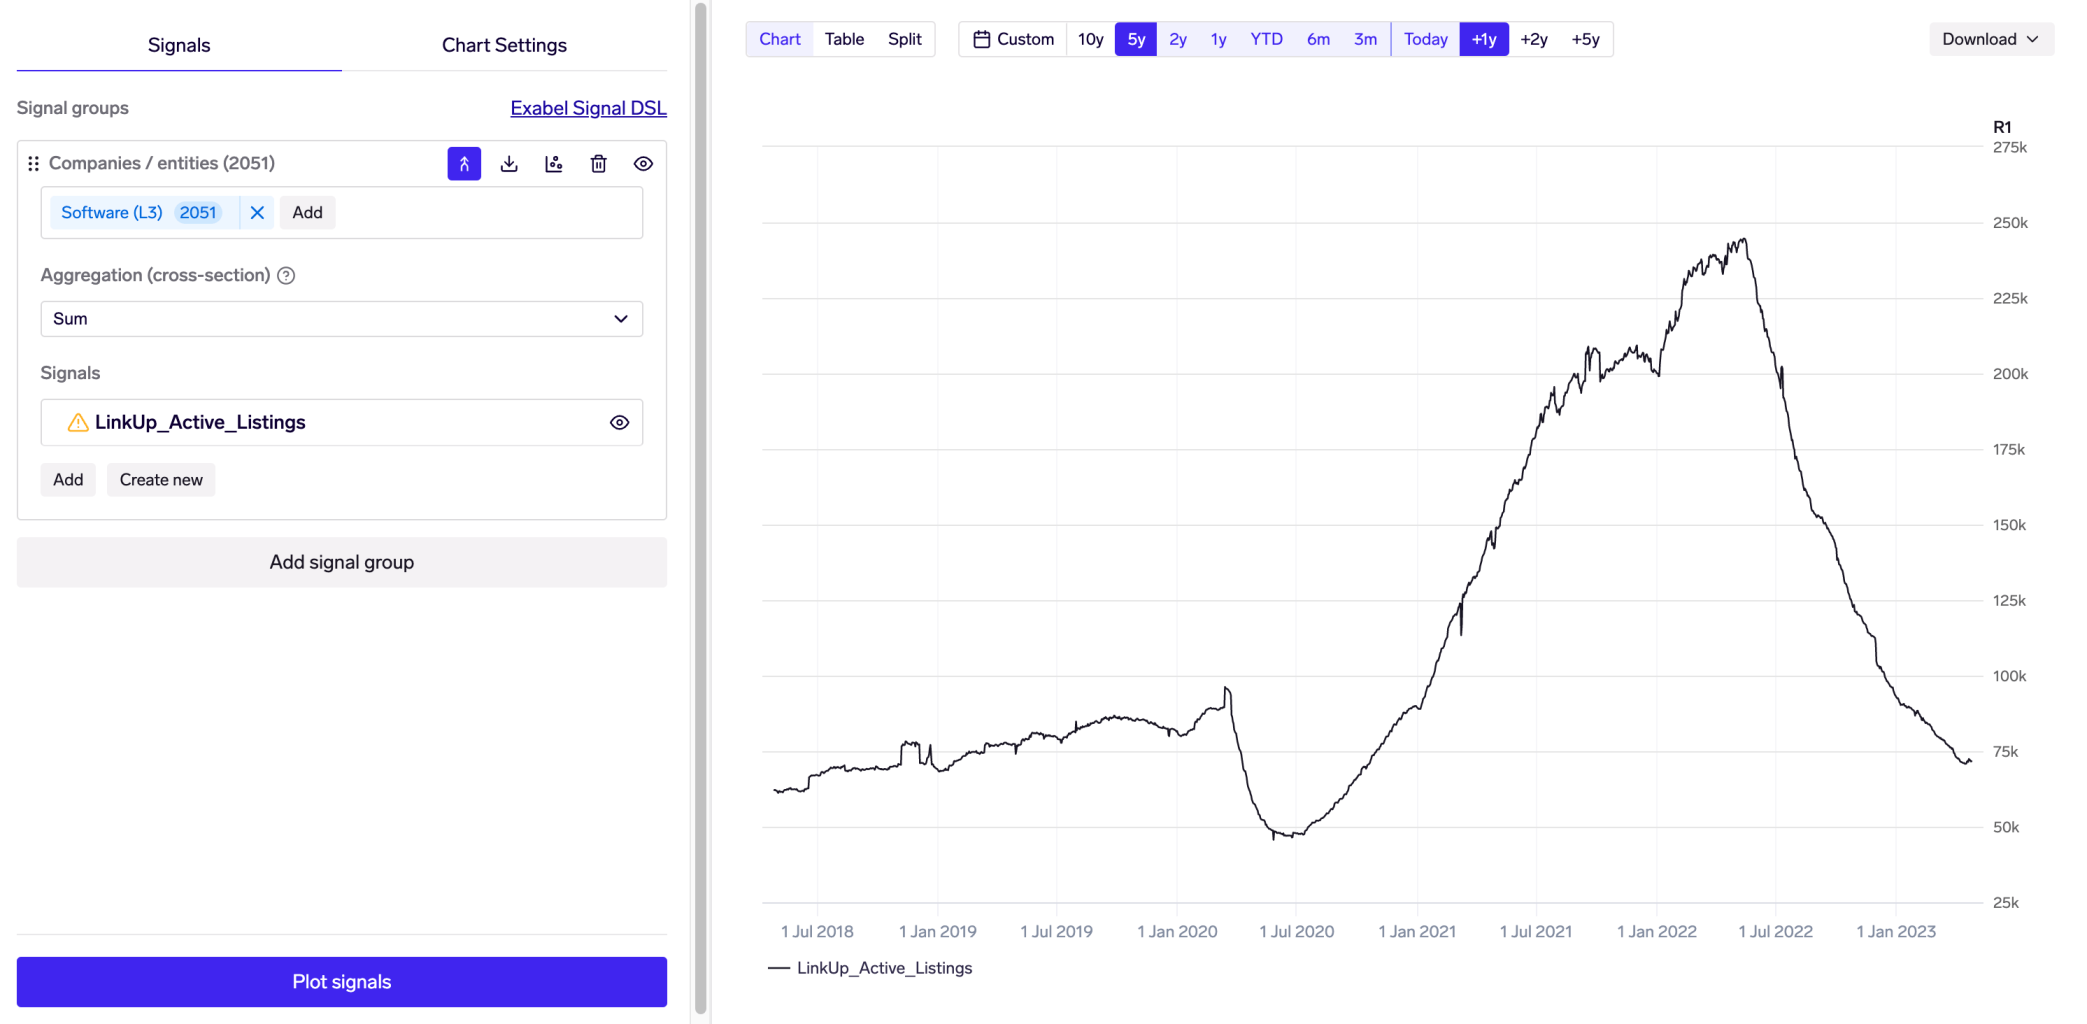
LinkUp Insights Platform - sum of active job listings across companies in the Software sector, showing the pandemic boom/bust in hiring
Enable cross-sectional aggregation by clicking on the  button, and selecting from one of the aggregation methods:
- Sum, Mean, Median: calculate the sum/mean/median of the signal across all companies / entities.
- Percent of total: divides each time series by the sum across all companies/entities. Commonly used for calculating and visualizing market share.
- Rank ascending/descending: calculates the rank of each time series over time. Useful for understanding how different companies or entities (e.g. web domains, mobile apps) are doing relative to each other.
Other new features
- Financial models: Allow specifying a specific company or entity for each row. This allows you to create financial models for a company that incorporate in financial or alternative data on its competitors or from other related entities (e.g. merchants, web domains). More generally, this also lets you leverage financial models to create table views for multiple companies at once.
- DSL: New Visible Alpha
va_metric()function, which returns the combination of actuals (for historical periods) and consensus (for future periods) as a single time series. - DSL: New
signal.sign()function, which returns the sign (+1, 0, or -1) of each value in a time series.
Improvements
- Dashboards: improve performance and responsiveness when opening dashboards with many widgets.
- Dashboards: tables may now be edited even while they are being calculated for the first time (e.g. after saving a copy of an existing dashboard, or after creating a new table). This resolves a pain point where after making a copy of a dashboard, you cannot make any edits to tables until they have finished calculating.
- Dashboards: charts, financial models, and portfolio strategy widgets may now be removed directly from the dashboard, through the ⋮ menu on the top-right of the widget, without going through the "Edit dashboard" modal. In a coming release, tables will also be removable through the same.
- Charts:
- Support: the support chat widget is now opened by clicking on "Contact support" in the help menu, and no longer occupies the space on the bottom-right of the screen.
- DSL: When retrieving Visible Alpha data via DSL functions, and a line item is not found for a given company, return an human-readable error rather than a generic warning.
- DSL: In comparisons (<, >, <=, >=) between signals, we first take the intersection (rather than the union) of the indexes, so that the result only contains those dates for which both signals have data.
- DSL: Drop the first (incomplete) period when using
signal.aggregate_over(...). This is because we are unable to determine the start date of that period, and hence may result in aggregating over arbitrarily long periods.
Bug fixes
- DSL: Rolling aggregation for an entity will not be affected by other entities being evaluated at the same time.
- Drill-downs: Fix issue where "Error" is displayed unintentionally on tables.
- Financial models: Fix number formatting where a configuration of 0 decimal places or "None" suffix did not apply.
- Signal explorer: Fix styling issue with the drag-and-drop handle in Safari.
- Import jobs: Fix issue where
0values were not displayed in the query preview. - Login: Improved error handling for users with an unverified email.