April 2024 update
In the past 2 months, we're shipped a new multi-company KPI Analyzer, allowing you to view KPI model predictions across your entire watchlist. Easily prioritize important KPIs by starring them, and sort/filter based on reporting date, delta vs consensus, model error, and hit rate. Additionally, we now estimate KPI model error using point-in-time analysis, helping you understand model accuracy based on where we are in a quarter. A revamped dashboard table builder, new signal expression (DSL) enhancements, and other various improvements and bug fixes round out an eventful March/April for Exabel.
New features
Multi-company KPI Analyzer
We have added a multi-company page where it is possible to select multiple companies that you want to see KPI mappings and predictions for. From the main menu, click on "KPIs" -> "KPI Analyzer":
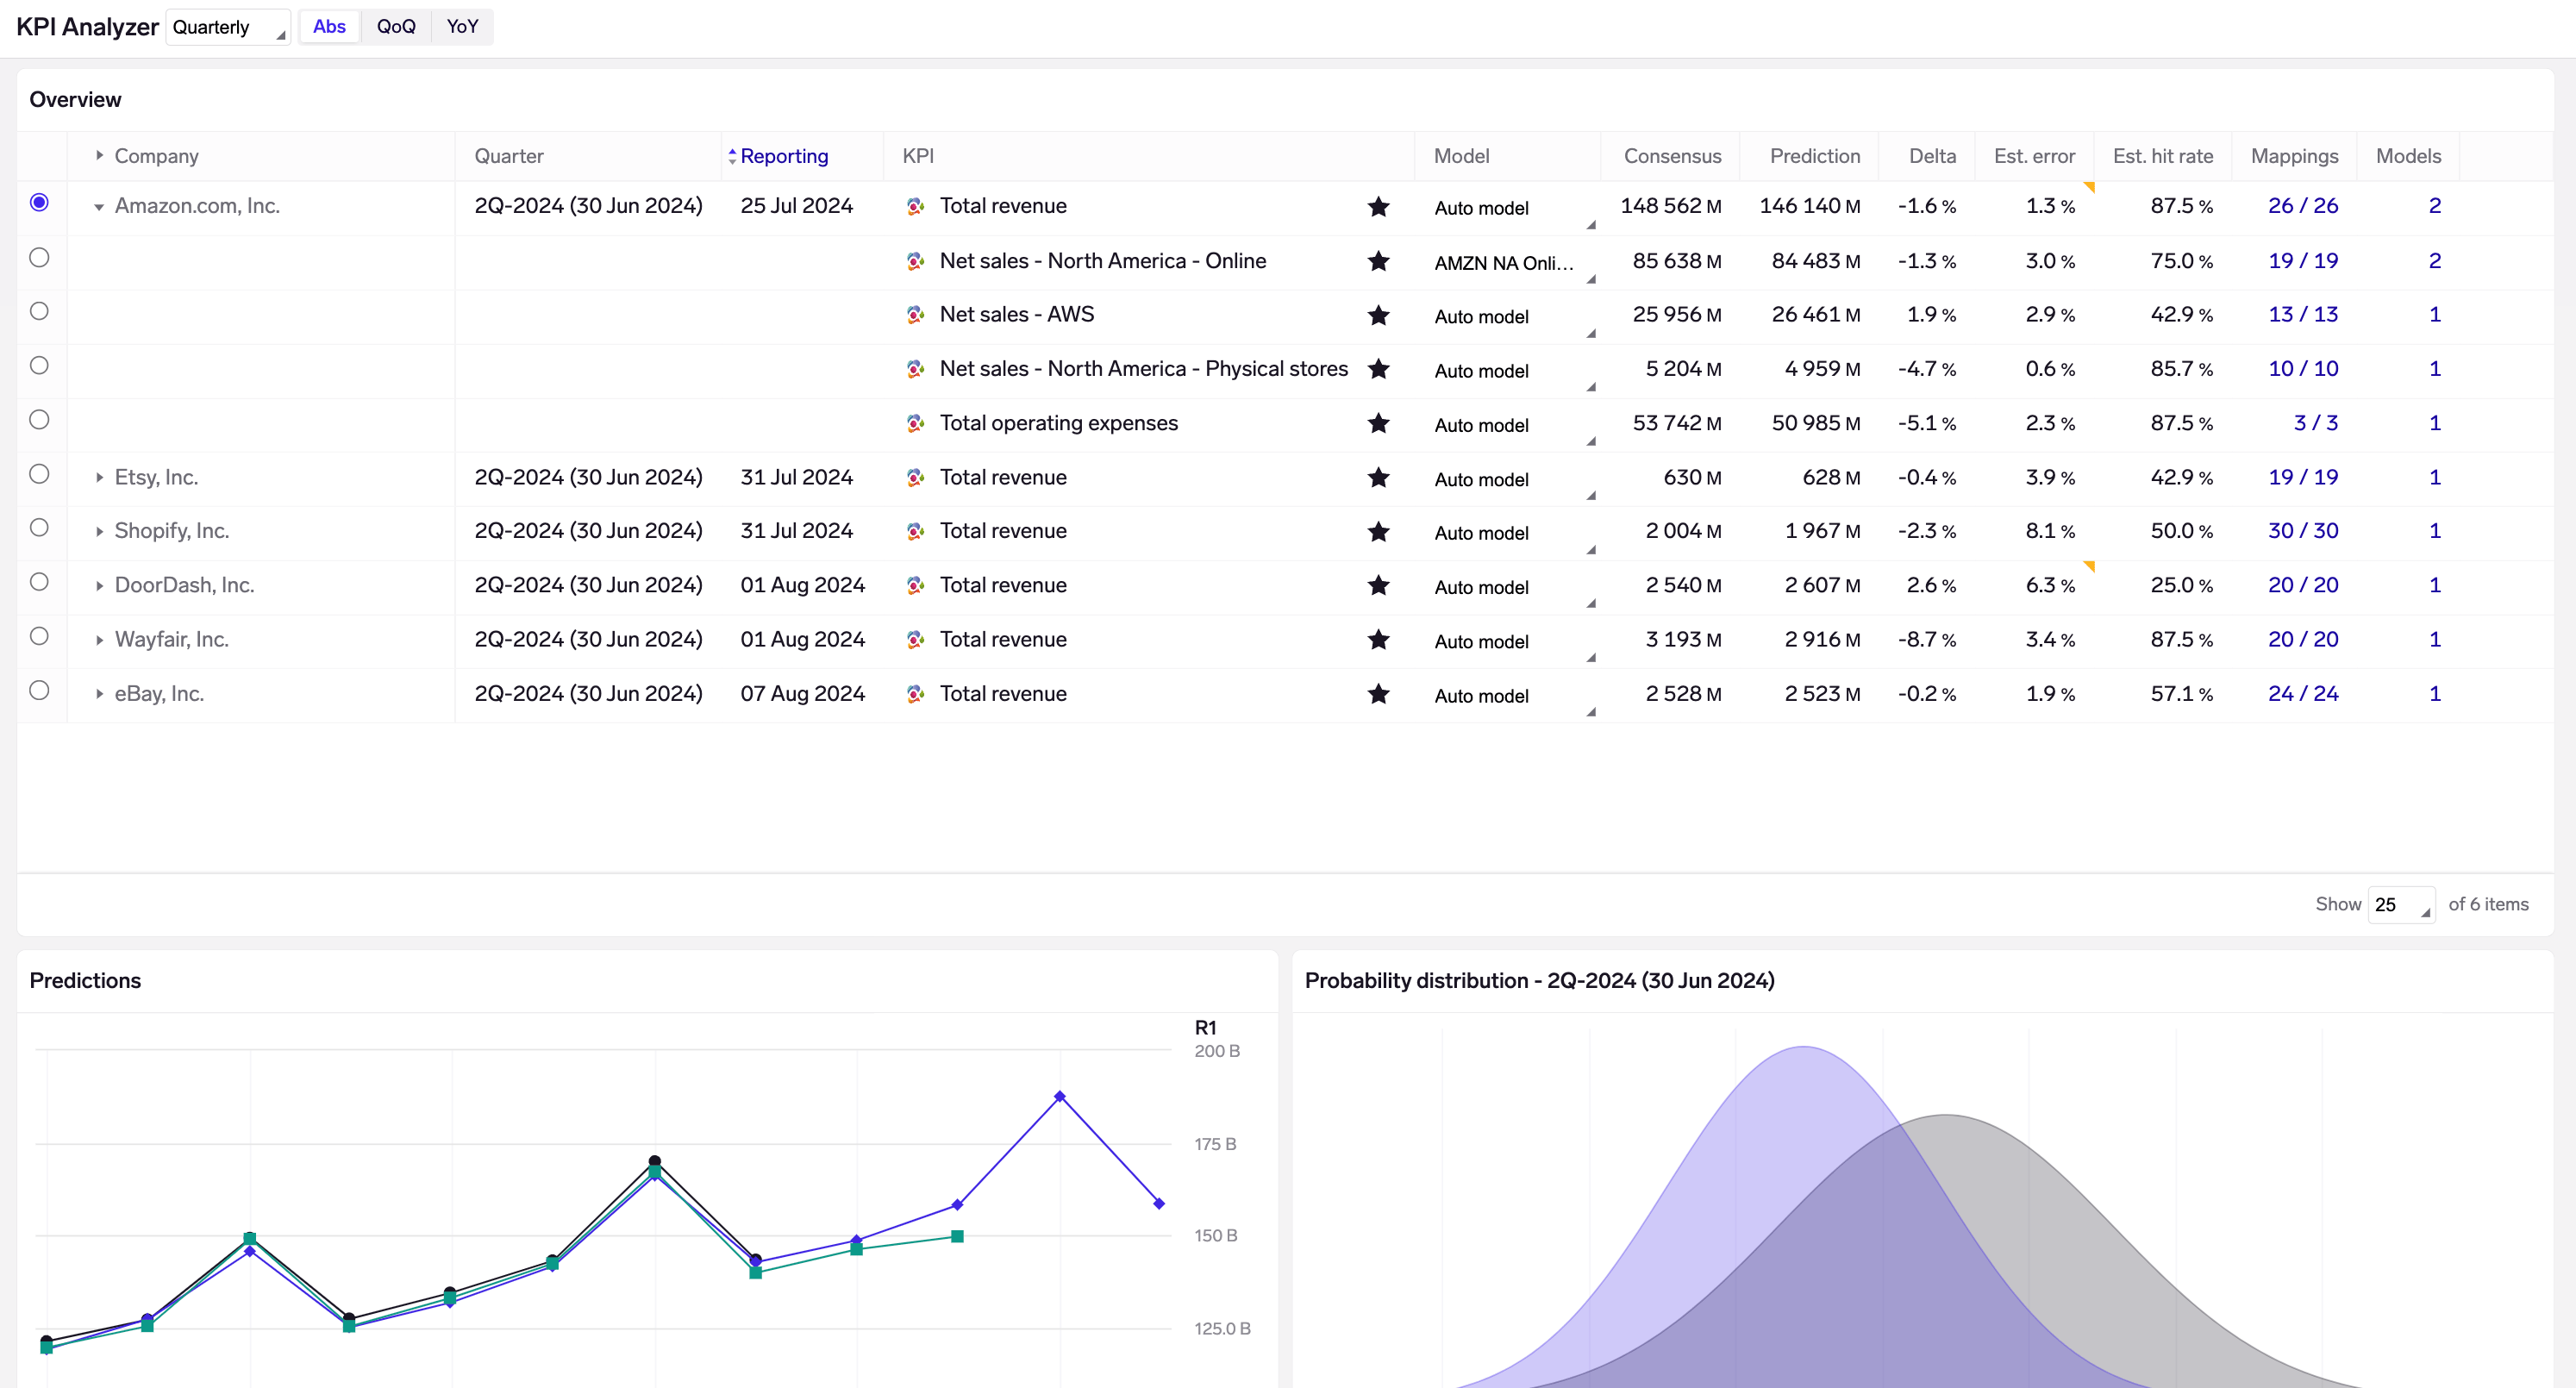
When starting out on the KPI Analyzer, this allows you to quickly start running models on the companies and KPIs you care about.
We recommend starring the KPIs that you think are most important, by clicking on the star icon next to each KPI. Subsequently, you can restrict the view to focus on starred KPIs by clicking on "Starred" in the table.
In this view, we allow for sorting & filtering to identify the most relevant results
- Companies may be sorted by report date, to focus on companies reporting next during earnings season
- Model predictions may be sorted & filtered on delta (vs consensus), error and hit rate, to screen for companies that are likely to beat/miss.
- You may also filter for only FactSet/Visible Alpha KPIs, and even for specific KPIs (eg "Total revenue")
Sorting is applied by clicking on the column you want to sort by. Filtering is applied by moving your mouse over the column and clicking on the ellipsis icon to add a filter.
Additionally, for each company-KPI, we now designate a "primary model". You may change the primary model by selecting it from the dropdown next to the KPI in the KPI Analyzer monitoring view. The primary model is always used for sorting and filtering in the KPI Analyzer.
KPI models: point-in-time error estimates
We have added support for plotting how prediction errors change over time through a quarter, as data for the quarter is incrementally available. This is based on point-in-time backtesting.
In the Models view, new "Est. error" and "Est. hit rate" columns in the Models view show these point-in-time error estimates. In the Monitoring view, these are shown by default.
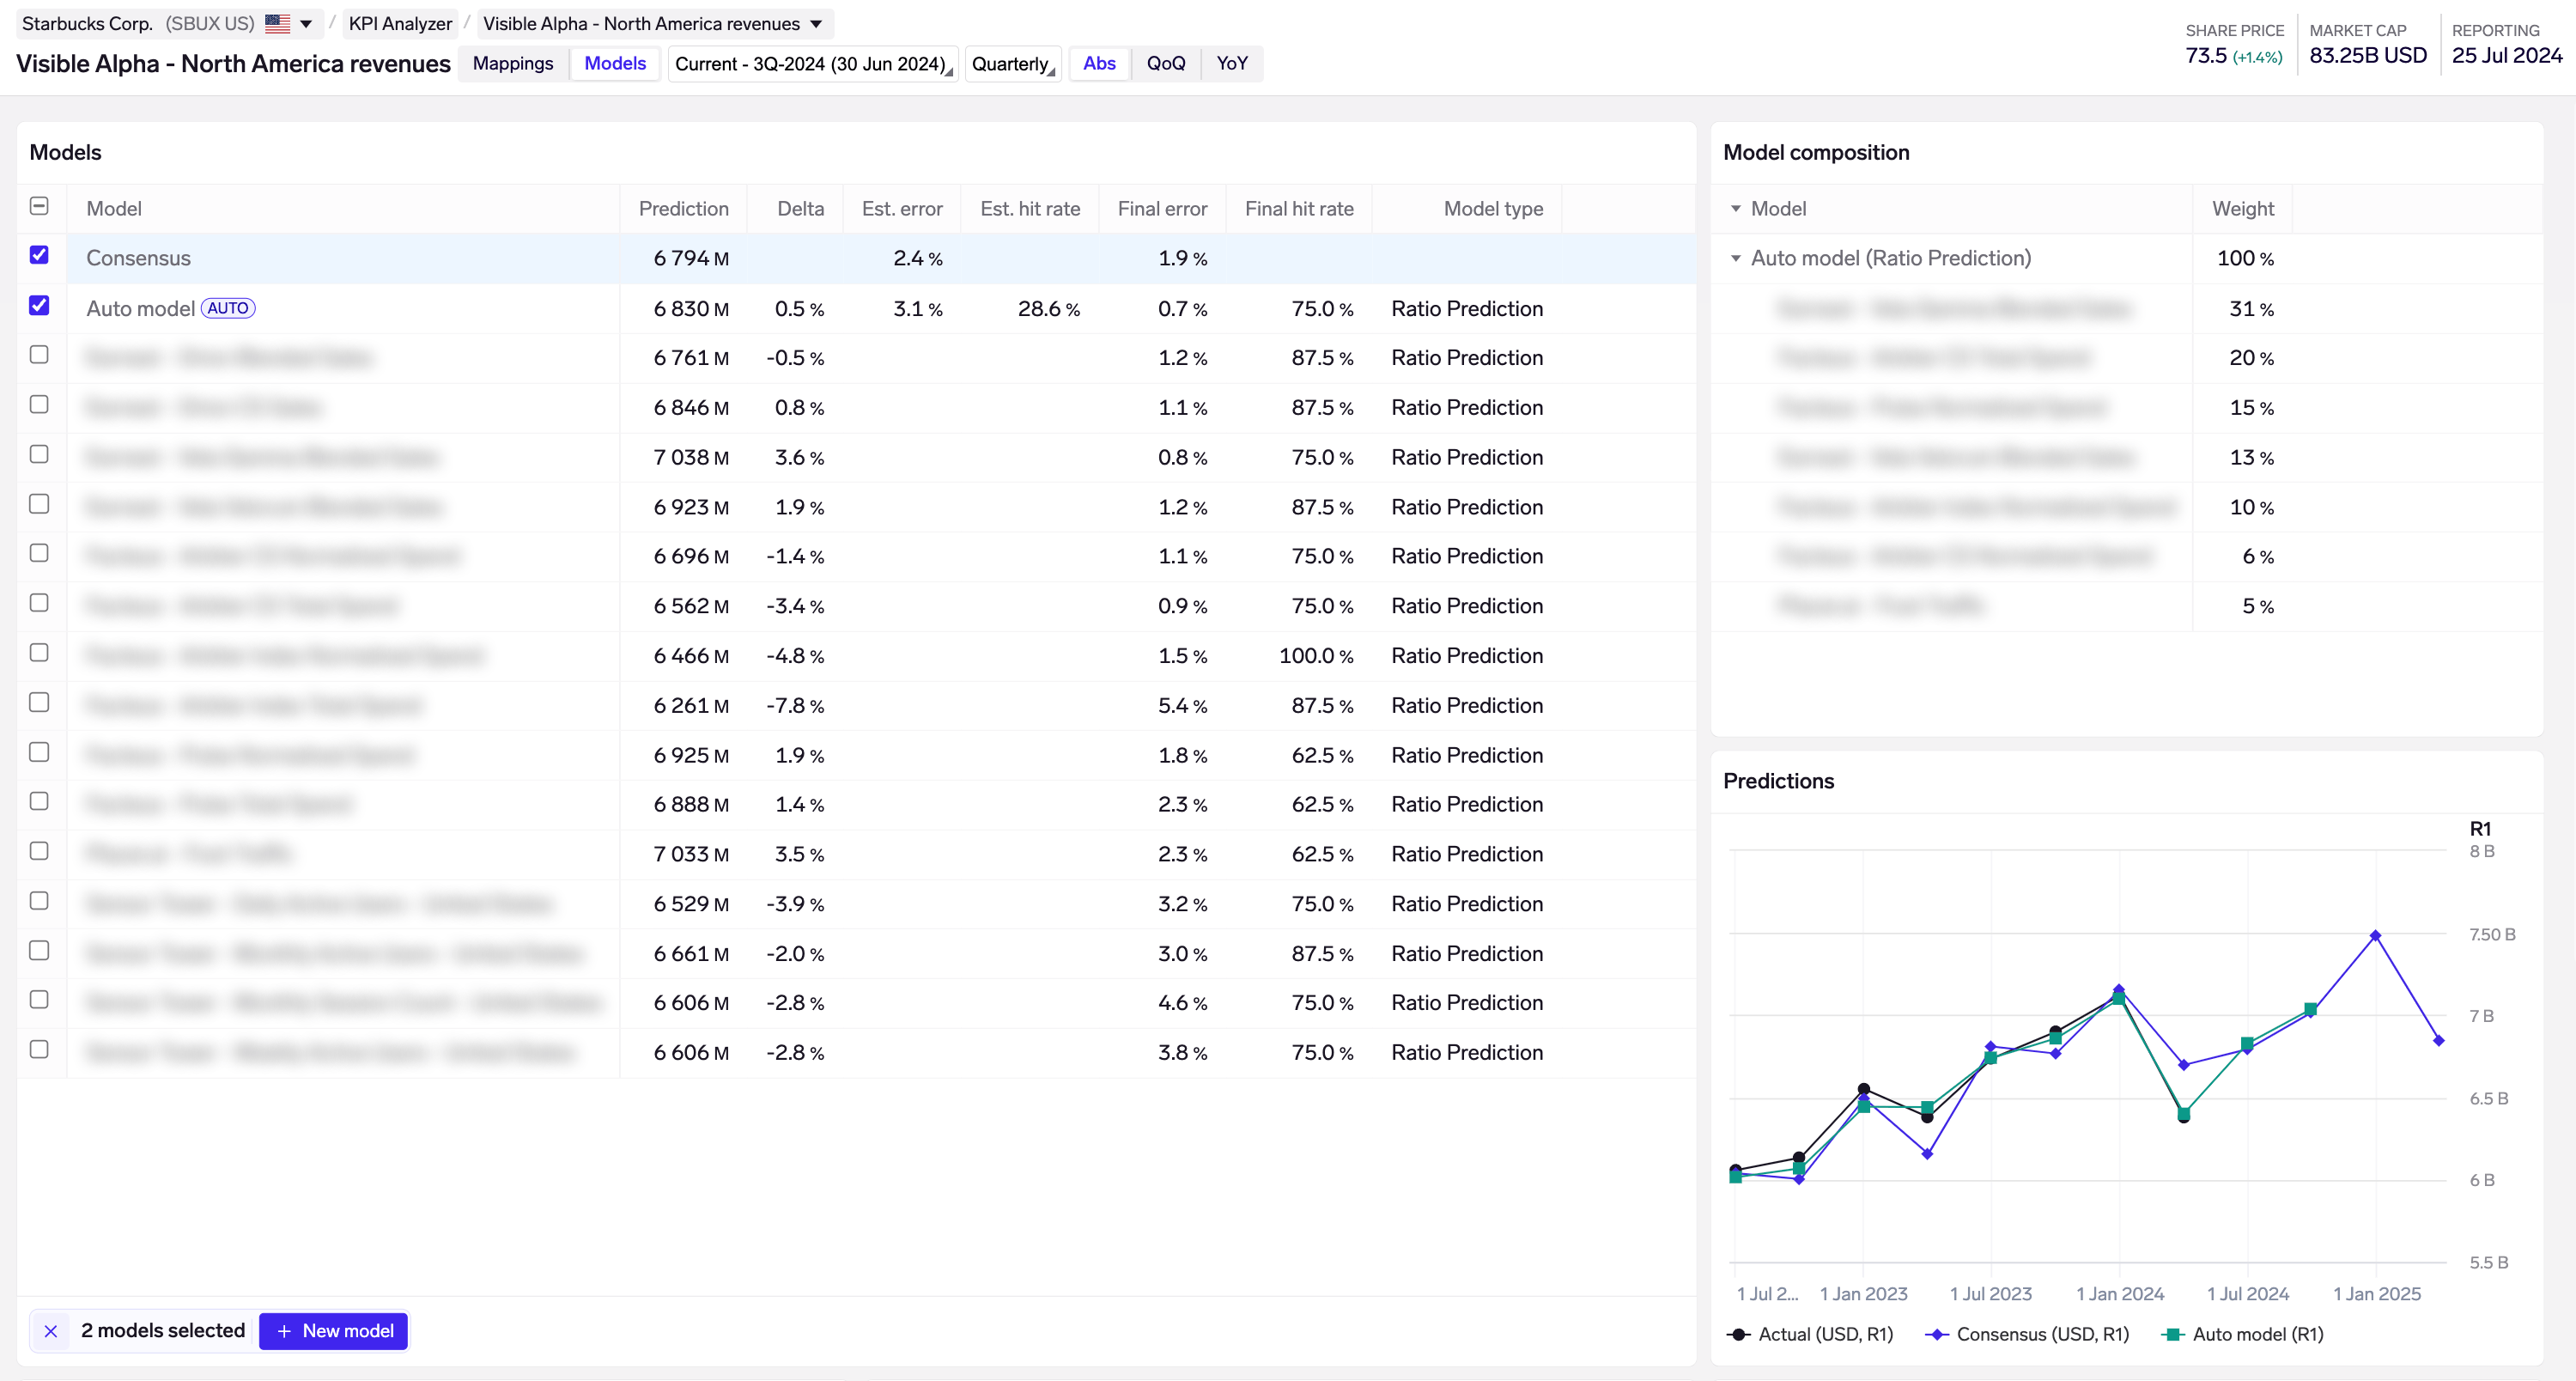
SBUX North America revenue: our Auto model has an estimated error of 3.1% based on where we are today (9 May 2024), while the final error of 0.7% indicates how accurate the model should be once all data is available.
Consensus error is also calculated on a like-for-like basis - here, consensus has a 2.4% error midway through the quarter, and a 1.9% error right before reporting.
The previous error and hit rate metrics are still available but referred to as the "final" error and hit rate, as they are based on having all data available for each historical period.
We have also introduced a new point-in-time analysis widget in the Models view, which shows how the model's estimated error changes as we progress through a quarter.
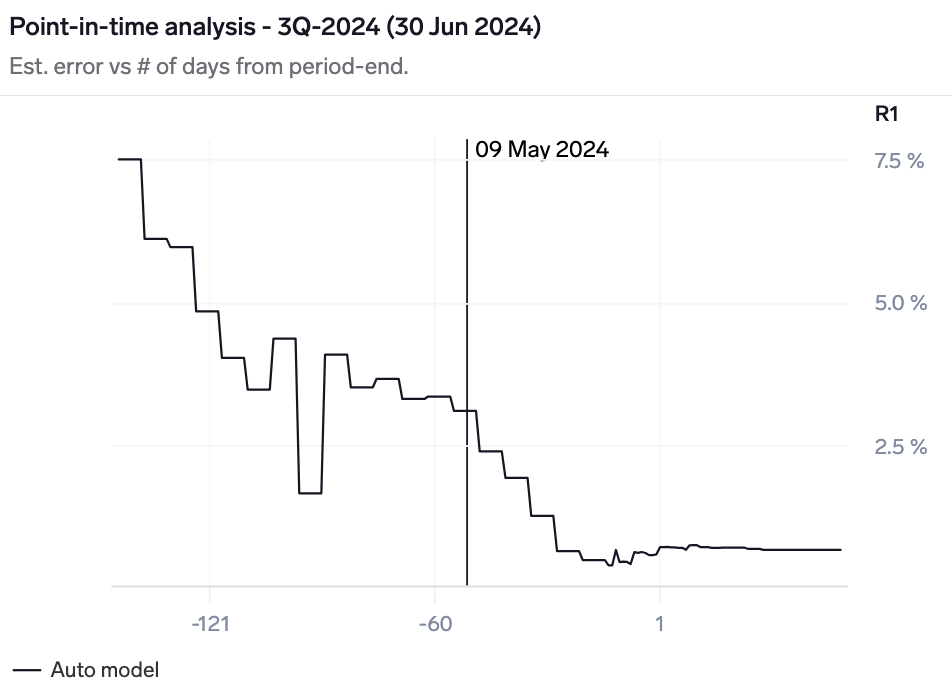
As of today (9 May 2024), the SBUX North America revenue model has an estimated error of 3.1% for F3Q-2024, given that we are ~50 days from quarter-end and thus have only partial data for the quarter. This reduces as we get closer to the end of the quarter.
Revamped dashboard table builder
Dashboards: We have made a new and simpler way to create and configure tables. It is now also possible to use inline signal expressions to define what data appears in each column, and also customize tooltips & number formatting (decimal places, units, suffixes) for each column.
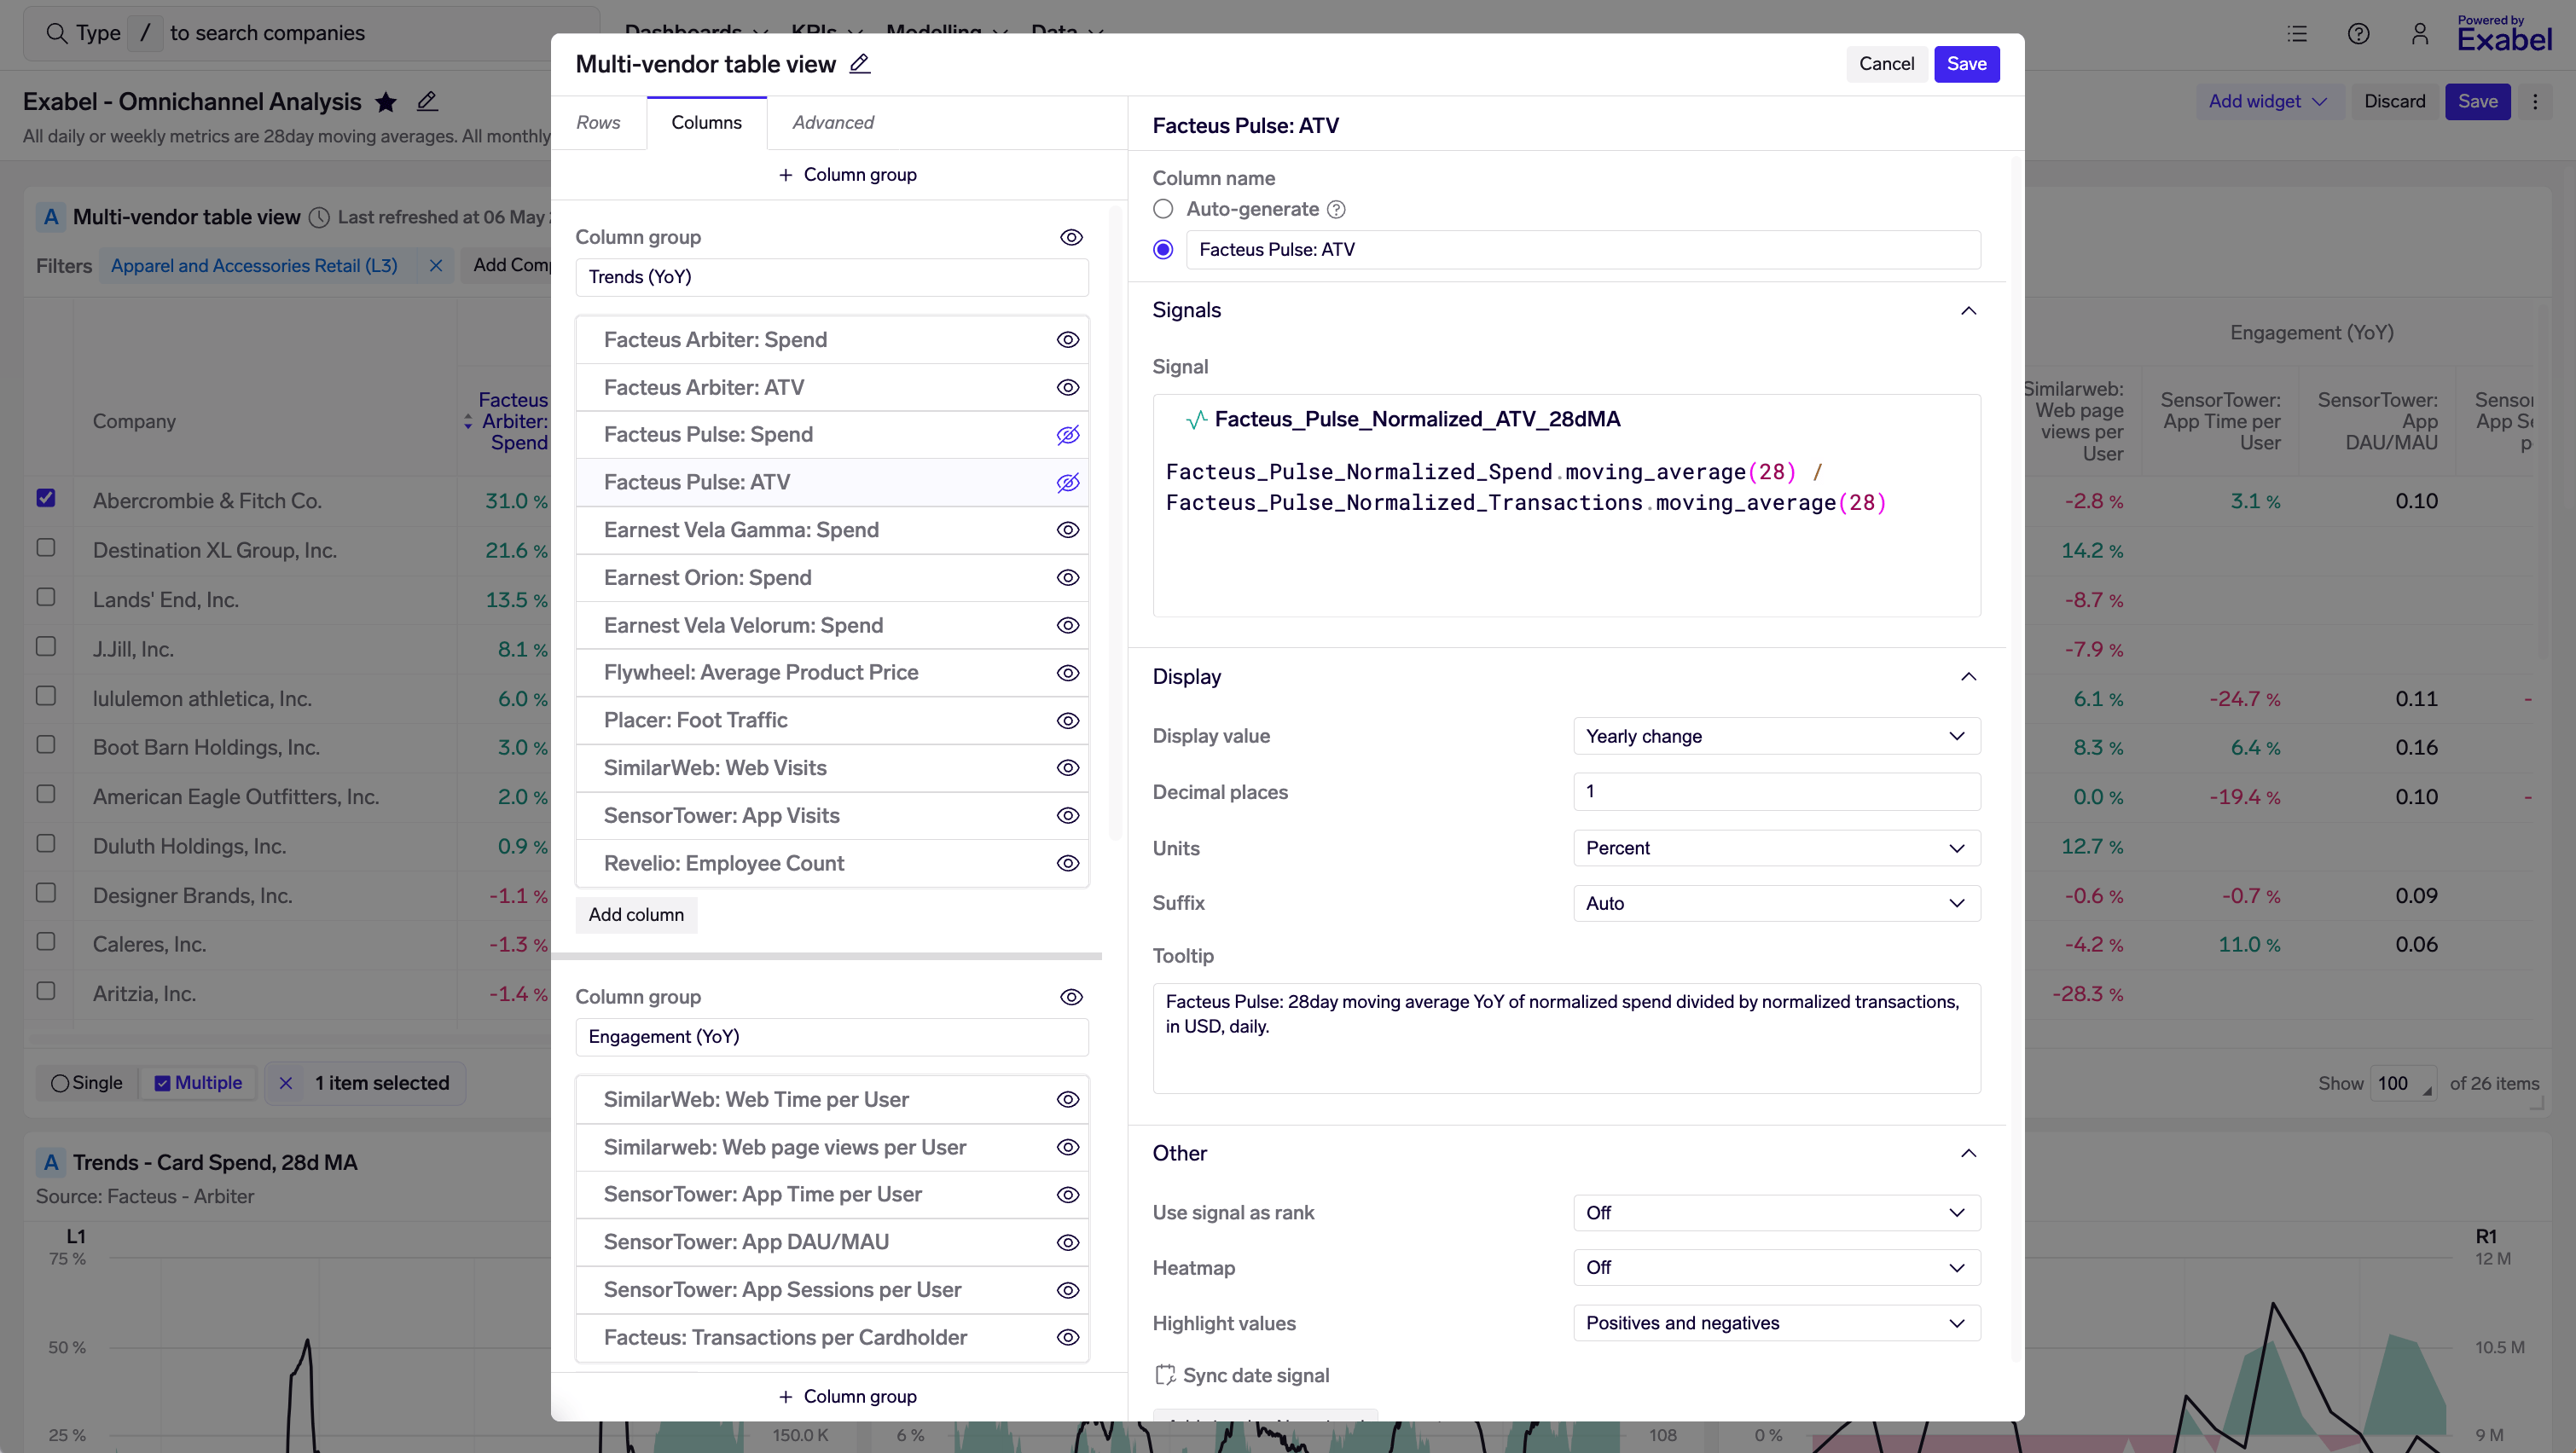
New dashboard table editor
Other new features
- Charts: New seasonality chart type to better visualize year-over-year changes in highly seasonal data.
- Entity overview: We have added an overview page for all types of entities, with links to data explorer and connected drill-downs.
- Signal expressions (DSL)
- Point-in-time: new
signal.as_of()function to evaluate the signal as-of a certain date, based on point-in-time history. - Point-in-time: new
signal.revisions()function, which returns a revisions time series of a specific date in the signal. - New
signal.at()function which returns the value (number) of a signal at a specific date. This can be used to creates indices, e.g.signal / signal.at('2018-01-01')to create a indexed signal starting at1on 1 Jan 2018. - New
signal.loc[]andsignal.iloc[]to select a slice of time series data based on dates or integer indices. These functions follow pandas behaviour. - New
signal.calendarize()to perform calendarization of data.
- Point-in-time: new
Improvements
- KPI Analyzer
- KPI Analyzer: Use unit of target time series to decide whether the KPI is a ratio when calculating KPI model metrics.
- Monitoring view: It is now possible to click on the count of mappings/models on each KPI to navigate to the Mappings and Models views.
- Mappings view: Added support for cloning and deleting KPI mappings. Cloning is especially useful for taking an existing vendor mapping and modifying it to optimize for predictive power.
- Mappings view: Display the date of the last data point, to understand how much lag is present.
- Mappings view: If an error occured while processing a KPI mapping, the error message is now shown in a tooltip on the "Final error" column.
- Models view: For each Auto & custom model, it is now possible to see details such as the user who created the model, when it was created, and when the predictions were last run.
- Models view: It is now possible to request a re-run of the Auto model. This may be useful to refresh the historical backtest error & hit rates, if many additional KPI mappings have been made. However, re-running the Auto model will reset the point-in-time model revision history; this is as if the Auto model was deleted and run from scratch.
- Models view: Added support for deleting prediction models, to allow for easier clean-up of unwanted models.
- Revisions widget: It is now possible to view consensus revisions for FactSet KPI estimates.
- Model composition widget: Show errors if a mapping has been excluded from a custom model.
- KPI Mapper:
- It is now possible to select companies as proxy entities.
- The default resampling method is changed to sum. This is the correct option for most cases.
- Company calendar: use data from FactSet about quarterly report dates, where available, even if the company primarily reports semi-annually.
- Entities: When clicking on an entity in the app, we now display its entity type alongside its name.
- Charts: Format tooltip with %/% pt/bps if the corresponding y-axis is formatted with these units.
- Company page: The company page header now includes a market data summary for the company.
- Data Explorer: The Data Explorer can now be accessed in the scope of a single entity.
- Data Explorer: When browsing the Data Explorer for a single company or entity, it is now possible to add a company or entity for comparison.
- Drill-down pages: The drill-down pages have got a face lift with the same design as the company and entity overview pages.
- Library: It is now possible to star your favourite charts.
- Menu: Show recent updated models and strategies in the Modelling and Stragies menus, respectively.
- Tags: Speed up browsing of companies/entities in a tag, by not retrieving the other tags that each entity also belongs to.
- Signal Expressions (DSL) - units handling (currencies)
- Pass-through units in multiplication and division operations, the
signal.sum(),signal.mean(),signal.median(),signal.min()andsignal.max()transforms, and in thesignal.for_type()andsignal.graph_filter()functions. - Handle units correctly in
signal.resample()-countshould have no unit, whilevarshould square the unit. - Return currencies from the FactSet and Visible Alpha revisions functions
fs_revisions()andva_revisions(). signal.convert_currency()can now be used on entities (e.g. merchants) to dynamically convert into the reporting currency of the parent company. To do this, use the expressionsignal.convert_currency('factset_estimate'). This requires that the underlying signal already has the correct currency set.
Alternatively, you can dosignal.convert_currency('USD', 'factset_estimate')to tell the system that the signal is originally in USD.
- Pass-through units in multiplication and division operations, the
- Signal Expressions (DSL): Support for
RYn,RQn,RSnandRQ/RSnas period arguments referring to a fiscal period relative to the last reported period. - Platform
- Significant performance improvements when importing time series data.
- Support for setting a "ratio" flag on time series. We are using this to annotate KPI time series from FactSet and Visible Alpha that should be treated as ratios - e.g. margins, growth rates, multiples.
Bug fixes
- KPI Analyzer
- Fixed an issue where the model closes when creating a new model, the user misses the checkbox and clicks the grey area around it instead.
- Fixed an issue where clicking on an entity chip in the popover toggles the selection of that row.
- Don't fail with non-positive predictor values on dates without a target value.
- KPI picker: Fixed an issue where some KPIs were shown with duplicate entries.
- Charts: Respect signal/signal group visibility toggle for pie, bar and column charts.
- Dashboards: Removed some unnecessary refreshing and refetching of data for tables.
- Import jobs: It is now possible to clear the alert email field.
- Signal Expressions (DSL)
- Fix bug which causes an exception if
signal.sum()is called on a signal that produces no data.
- Fix bug which causes an exception if
- Platform
- Delete data set tags when data sets are deleted.