Introducing KPI model quality and revisions
We have introduced a new model quality metric to the KPI Analyzer and Screener, providing a clear visual indicator of which KPI models are most accurate. We have also added new columns showing model revisions over the past 1 week & month, to better indicate which KPIs are seeing upgrades/downgrades.
In the KPI Screener, these new metrics allow you to screen for stock ideas backed by accurate KPI models, and with significant revisions:
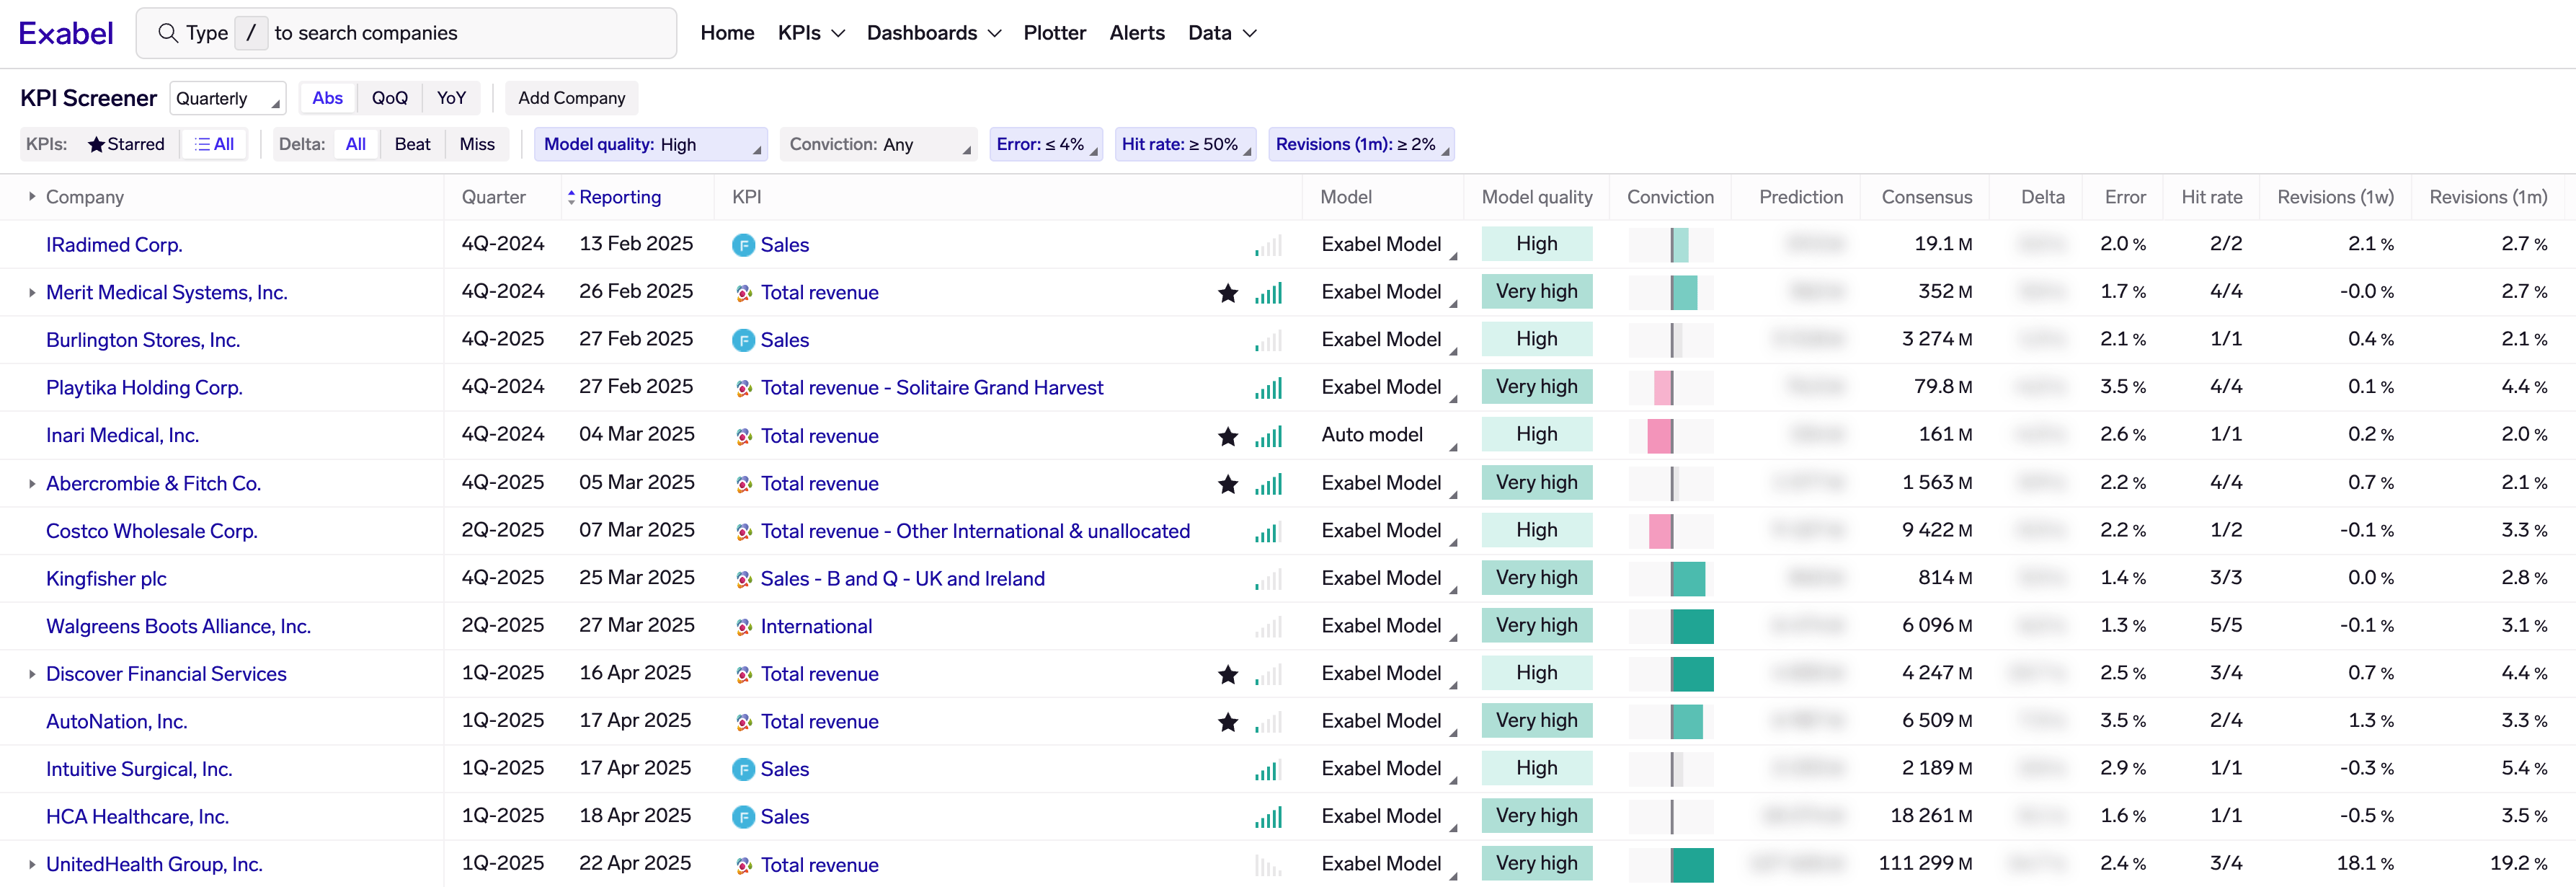
KPI Screener: screening for High / Very high model quality scores, low error rates, >50% hit rate, and >+2% revisions in the past month.
In the KPI Analyzer, model quality is shown next to each model - click to see details. Revisions are shown further to the right:
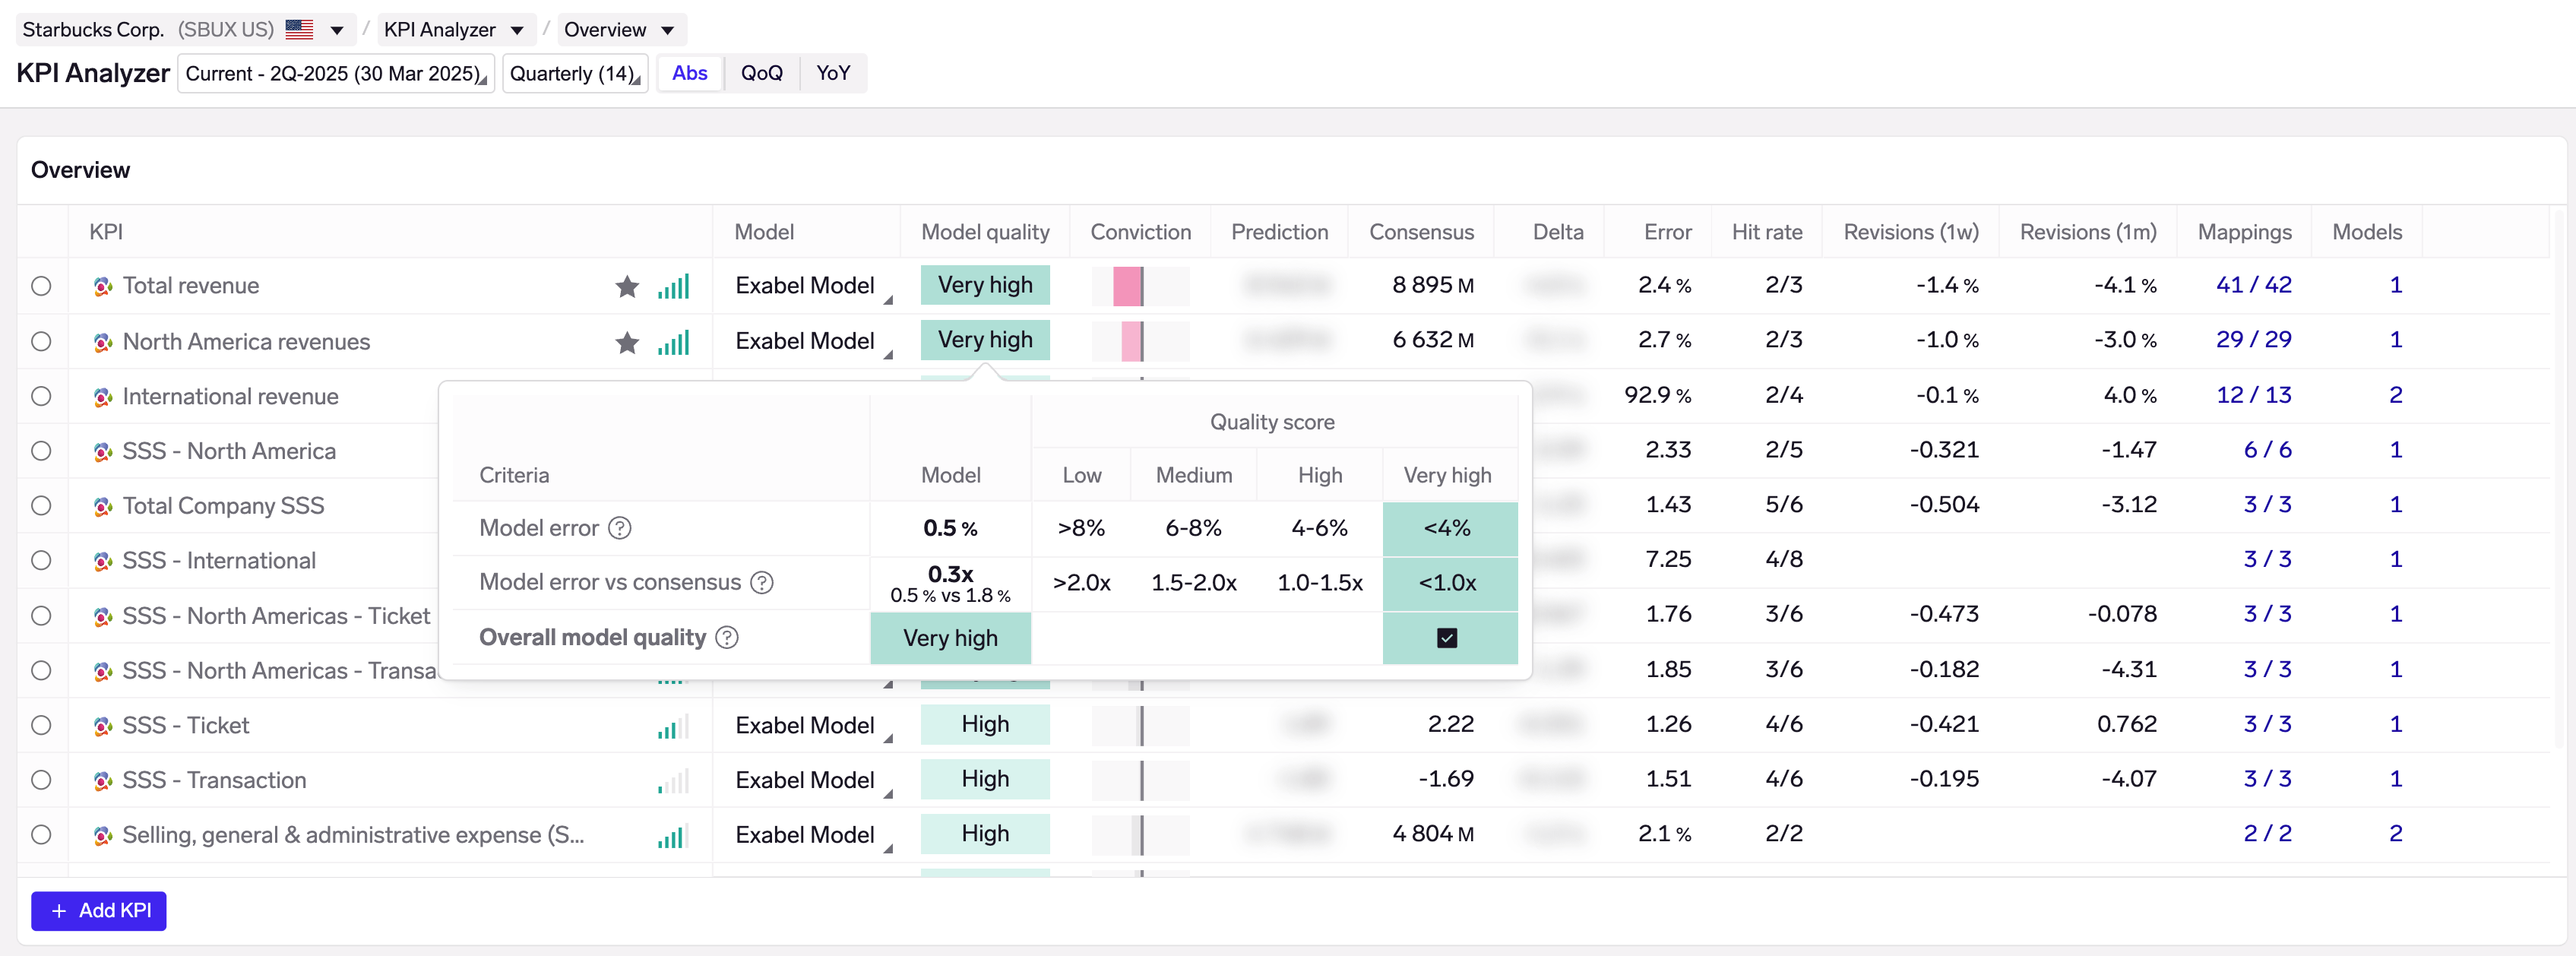
KPI Analyzer: model quality and revisions are now shown in the main table. Click on model quality to see the assessment, and on revisions to see a chart of model & consensus revisions.
About model quality
Our new model quality metric is based on: (1) model error (2) model error vs consensus error. In Exabel, model error has always been shown next to the predictions, but it was not immediately obvious if the model was more accurate than consensus. For example, a model might have a seemingly low error (MAPE) of 2%, but if consensus for that KPI averages a <1% error, the model might not be providing much of an edge. Conversely, a model that has a relatively high error of 5-6% might be valuable if consensus averages a 10% error.
Note that for model quality, we use the "Final error" metric of a model. This is the model's error when all data is available for a quarter, as opposed to the "Est. error" which estimates the model error based on where we are in the quarter. Using final error produces a stable model quality metric, rather than one that varies over a quarter.
About model revisions
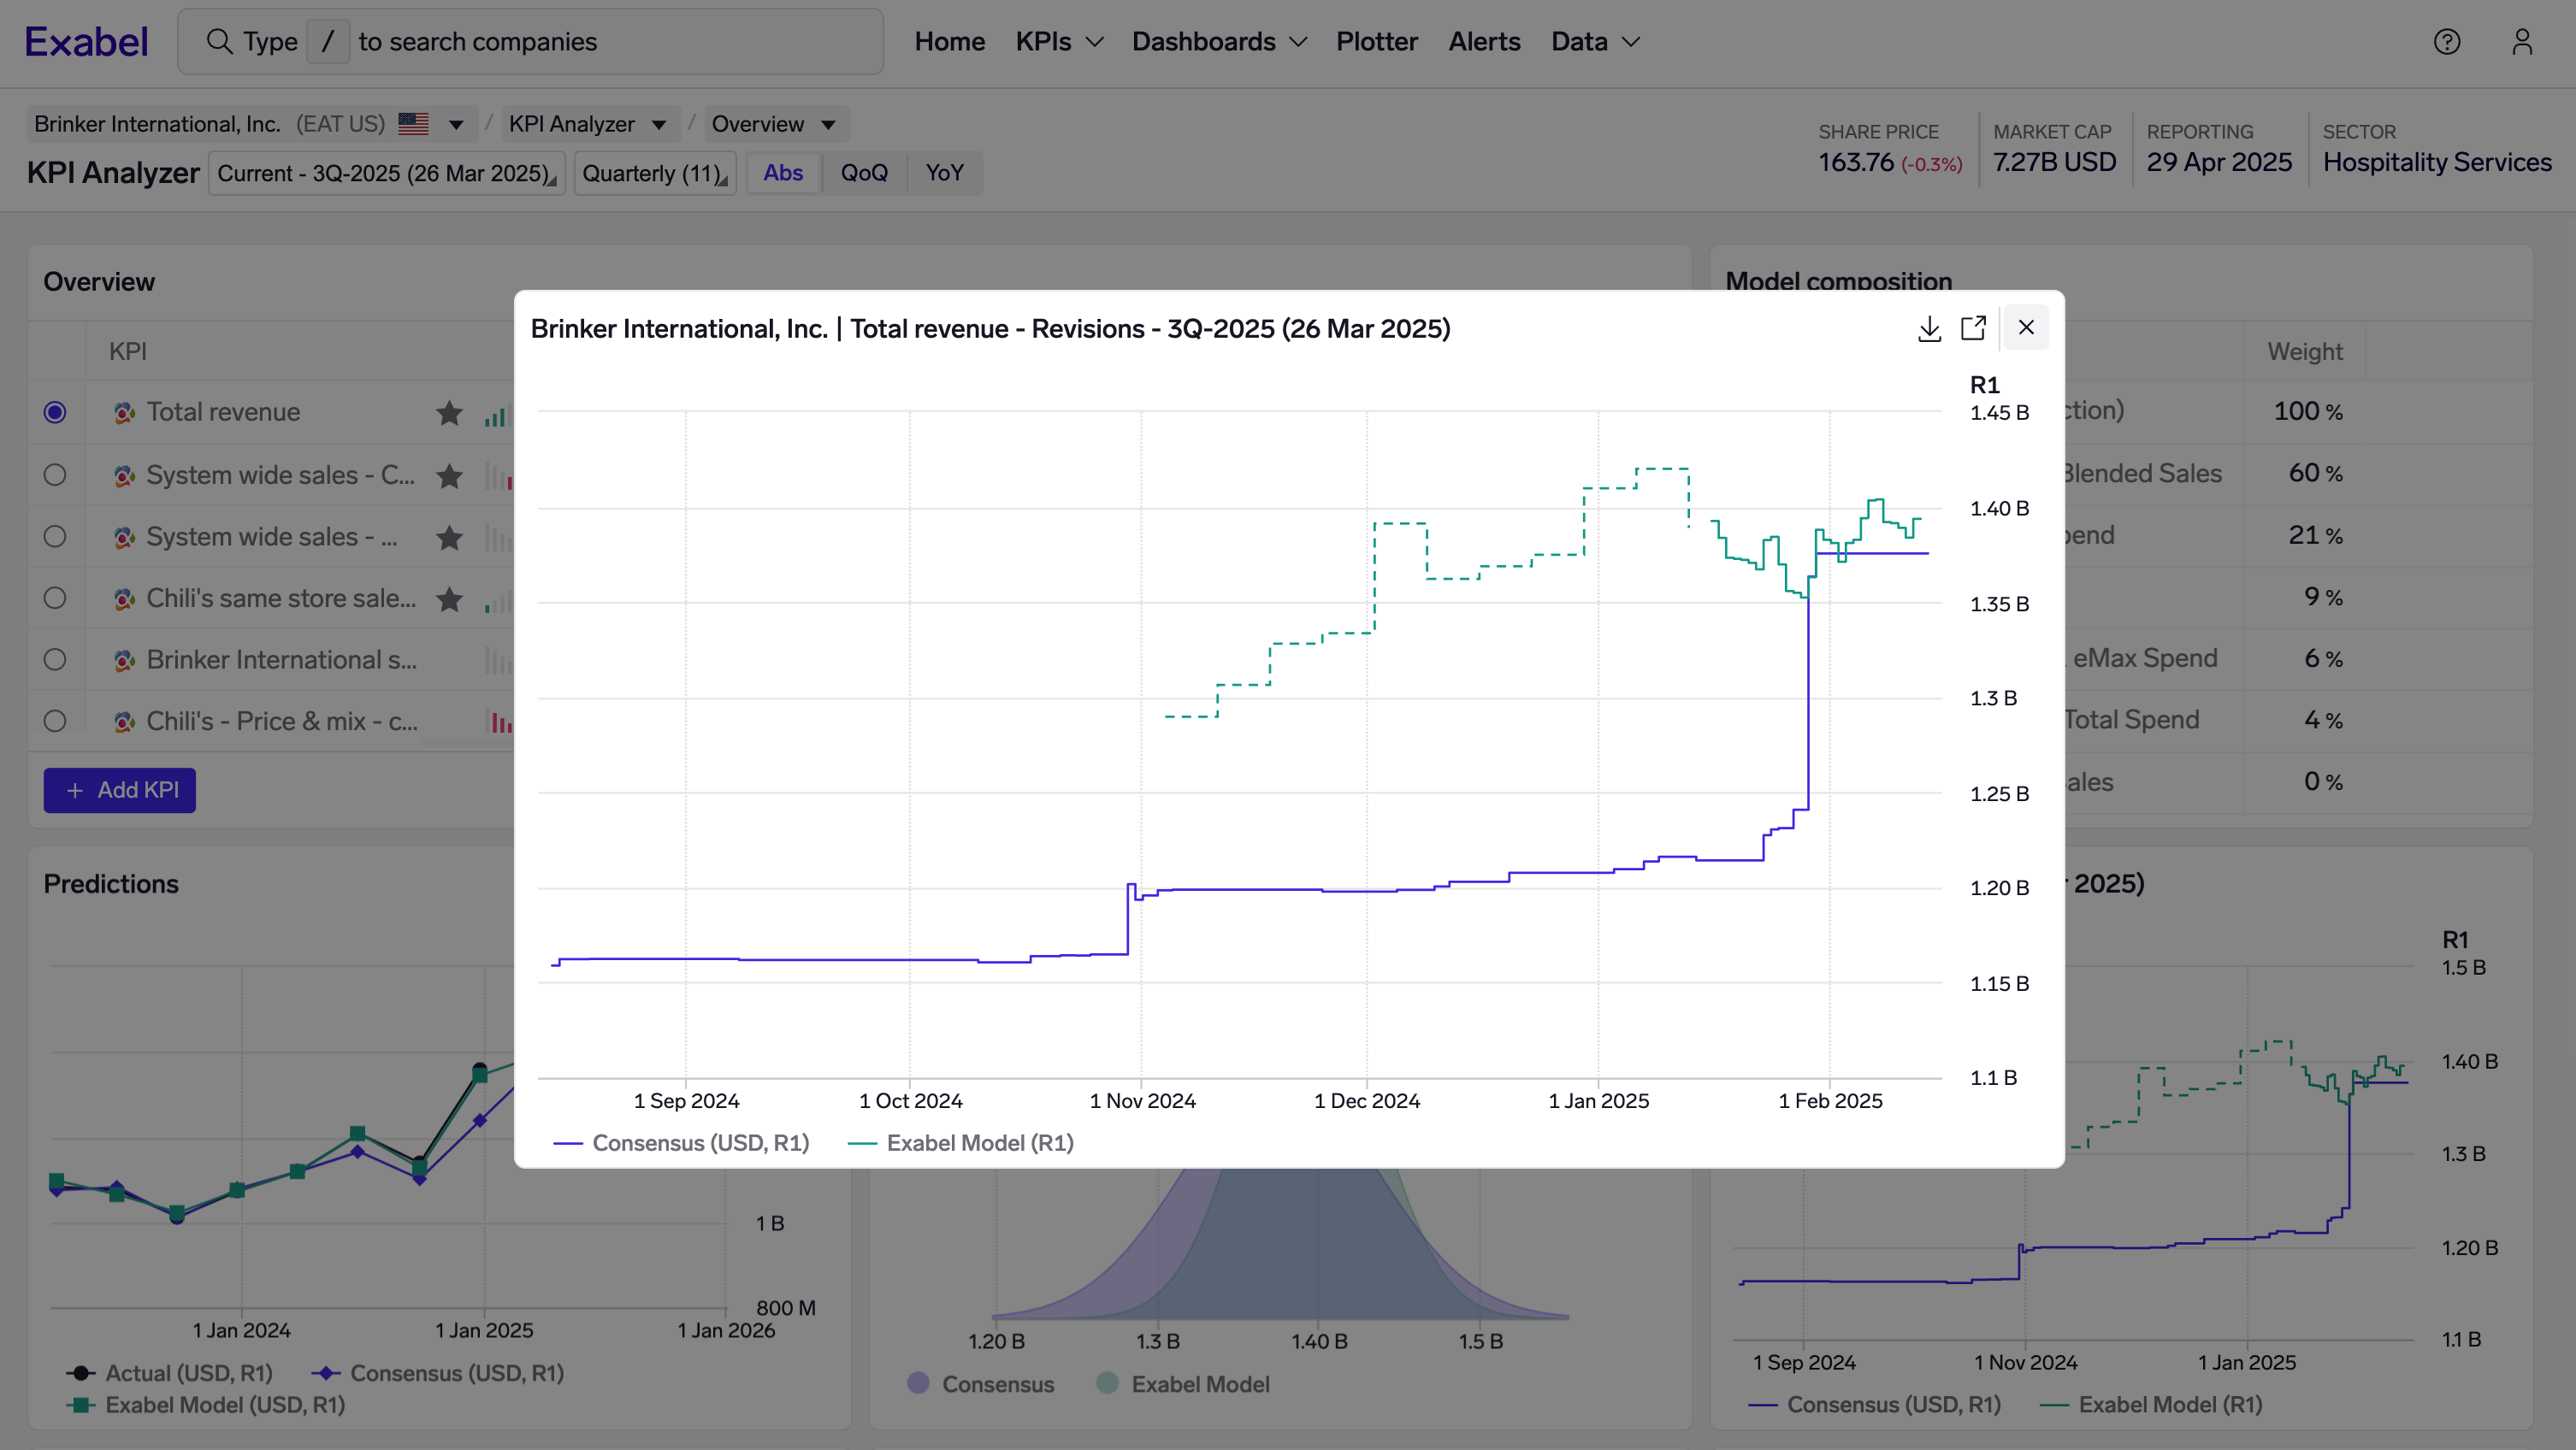
Model revisions are calculated from the existing revisions charts that are shown whenever a KPI is selected. You can also click on the revisions number in the table to see the revisions chart: