June 2024 update
In the past 2 months, we’ve revamped the landing page, added support for more open-source & proprietary KPI model types, updated the sharing experience, and now allow creating dashboard tables with child rows. Plus, enjoy numerous improvements and bug fixes across the platform for a smoother experience.
New features
Landing page
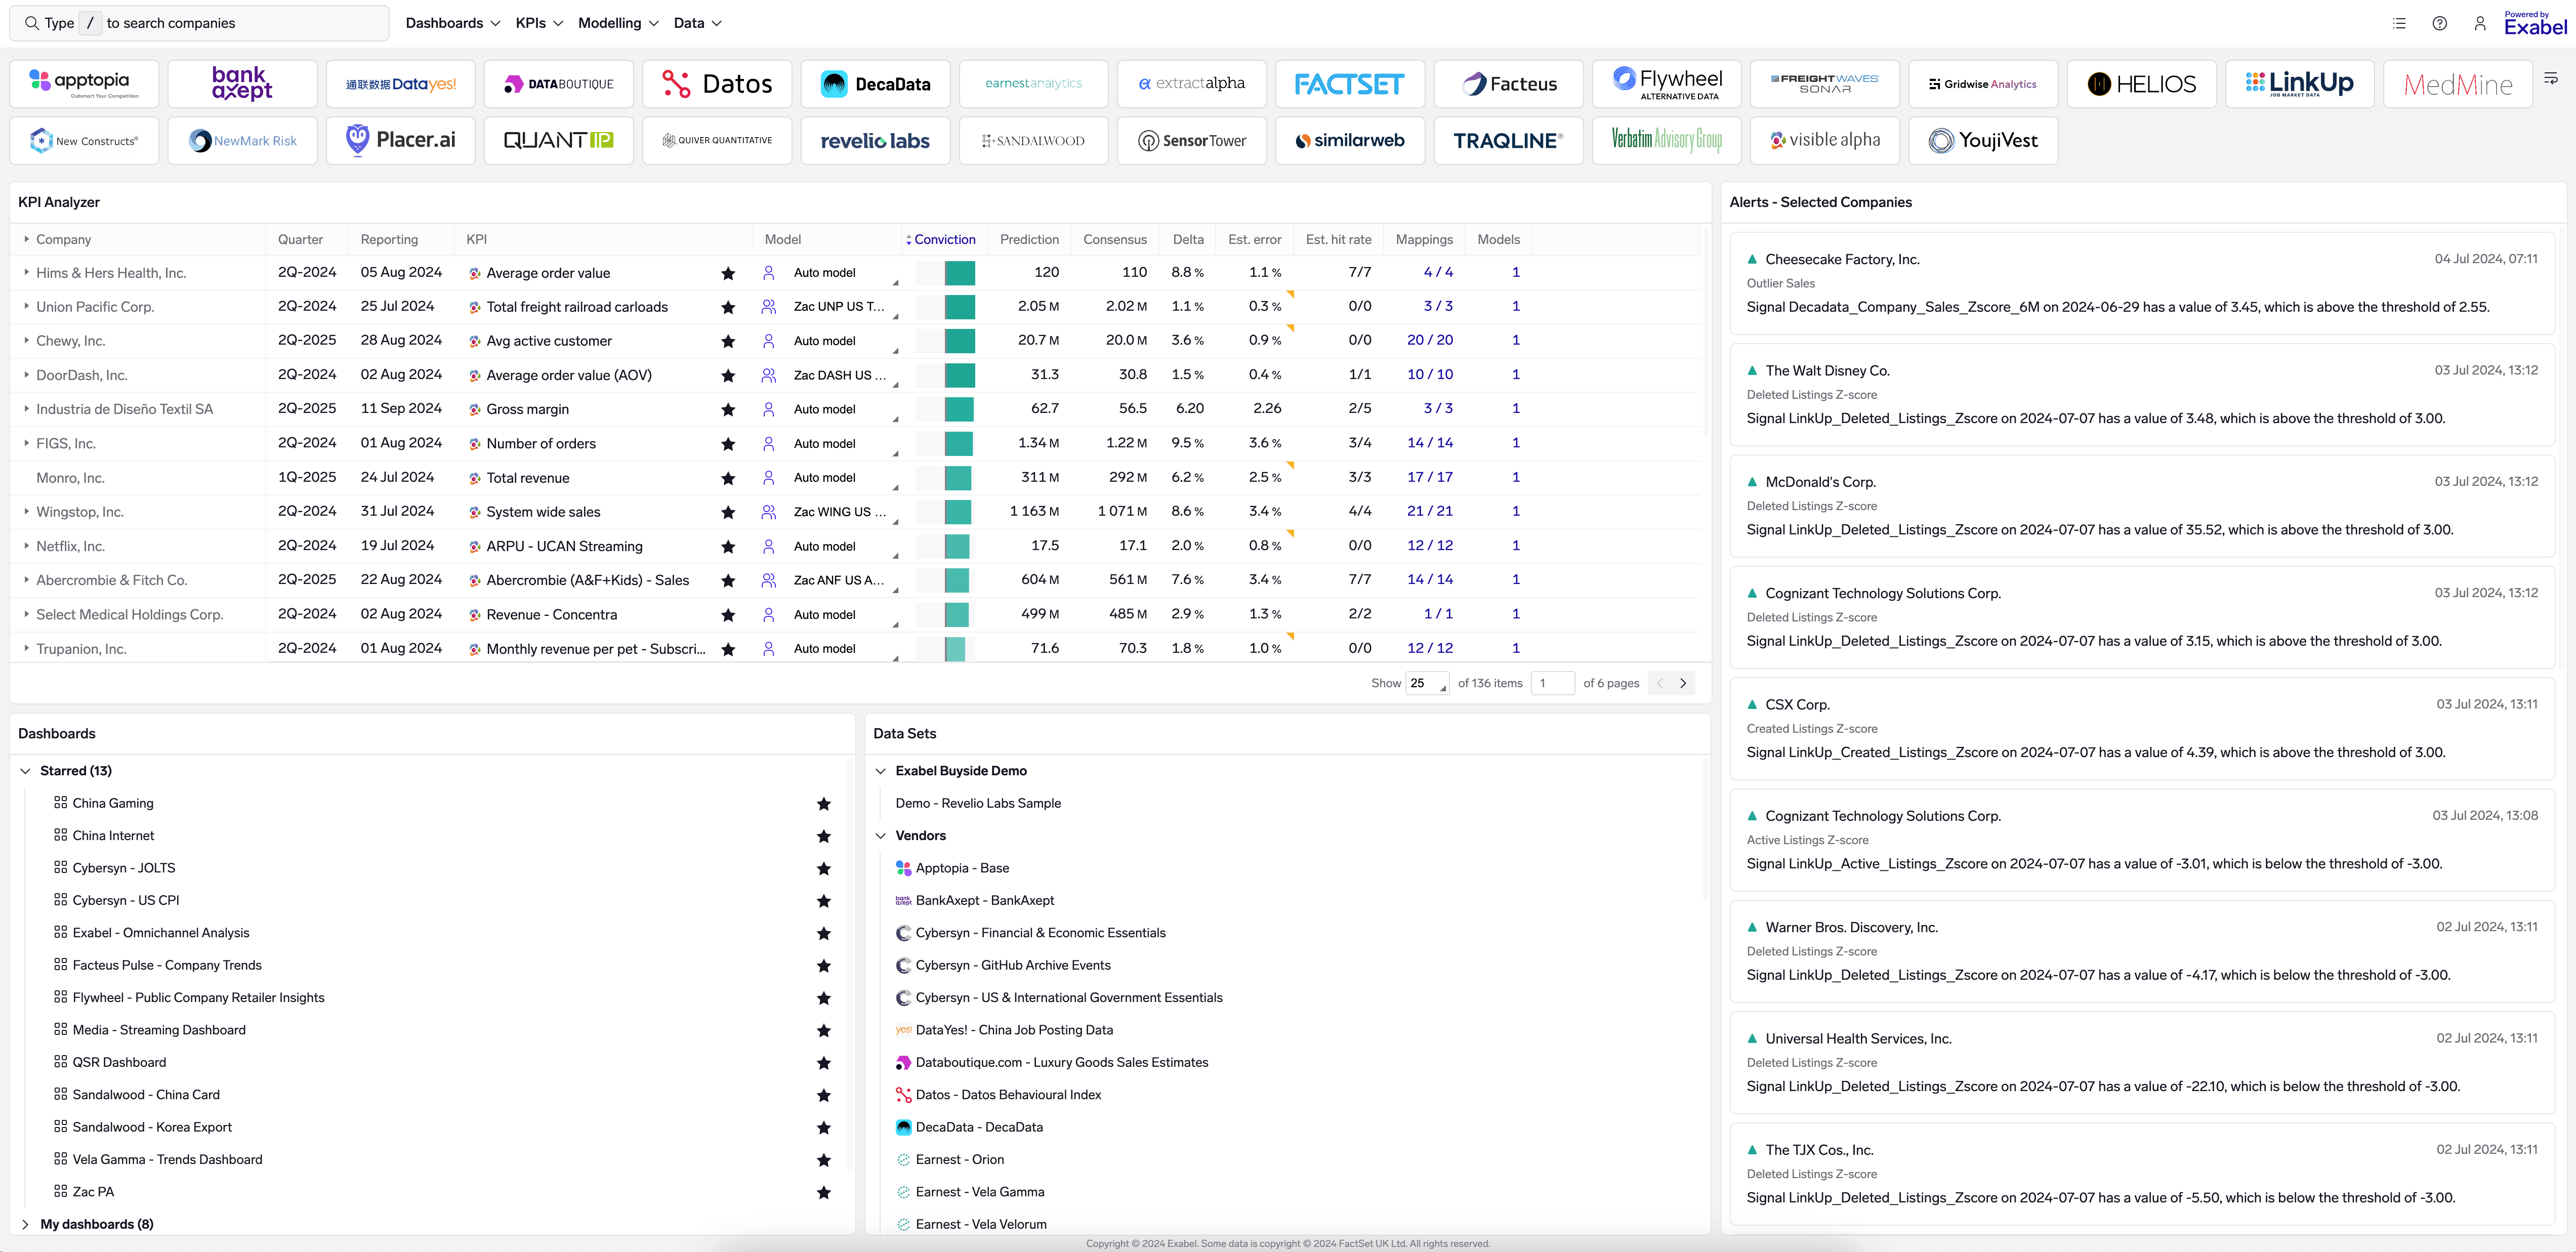
The landing page has been revamped to act as a personalized home page, showing the KPI Analyzer, your alerts feed, and your vendor subscriptions, dashboards and data sets. Set a watchlist on the KPI Analyzer widget to get started - any changes & filtering you do here will be persisted for when you come back.
KPI model conviction
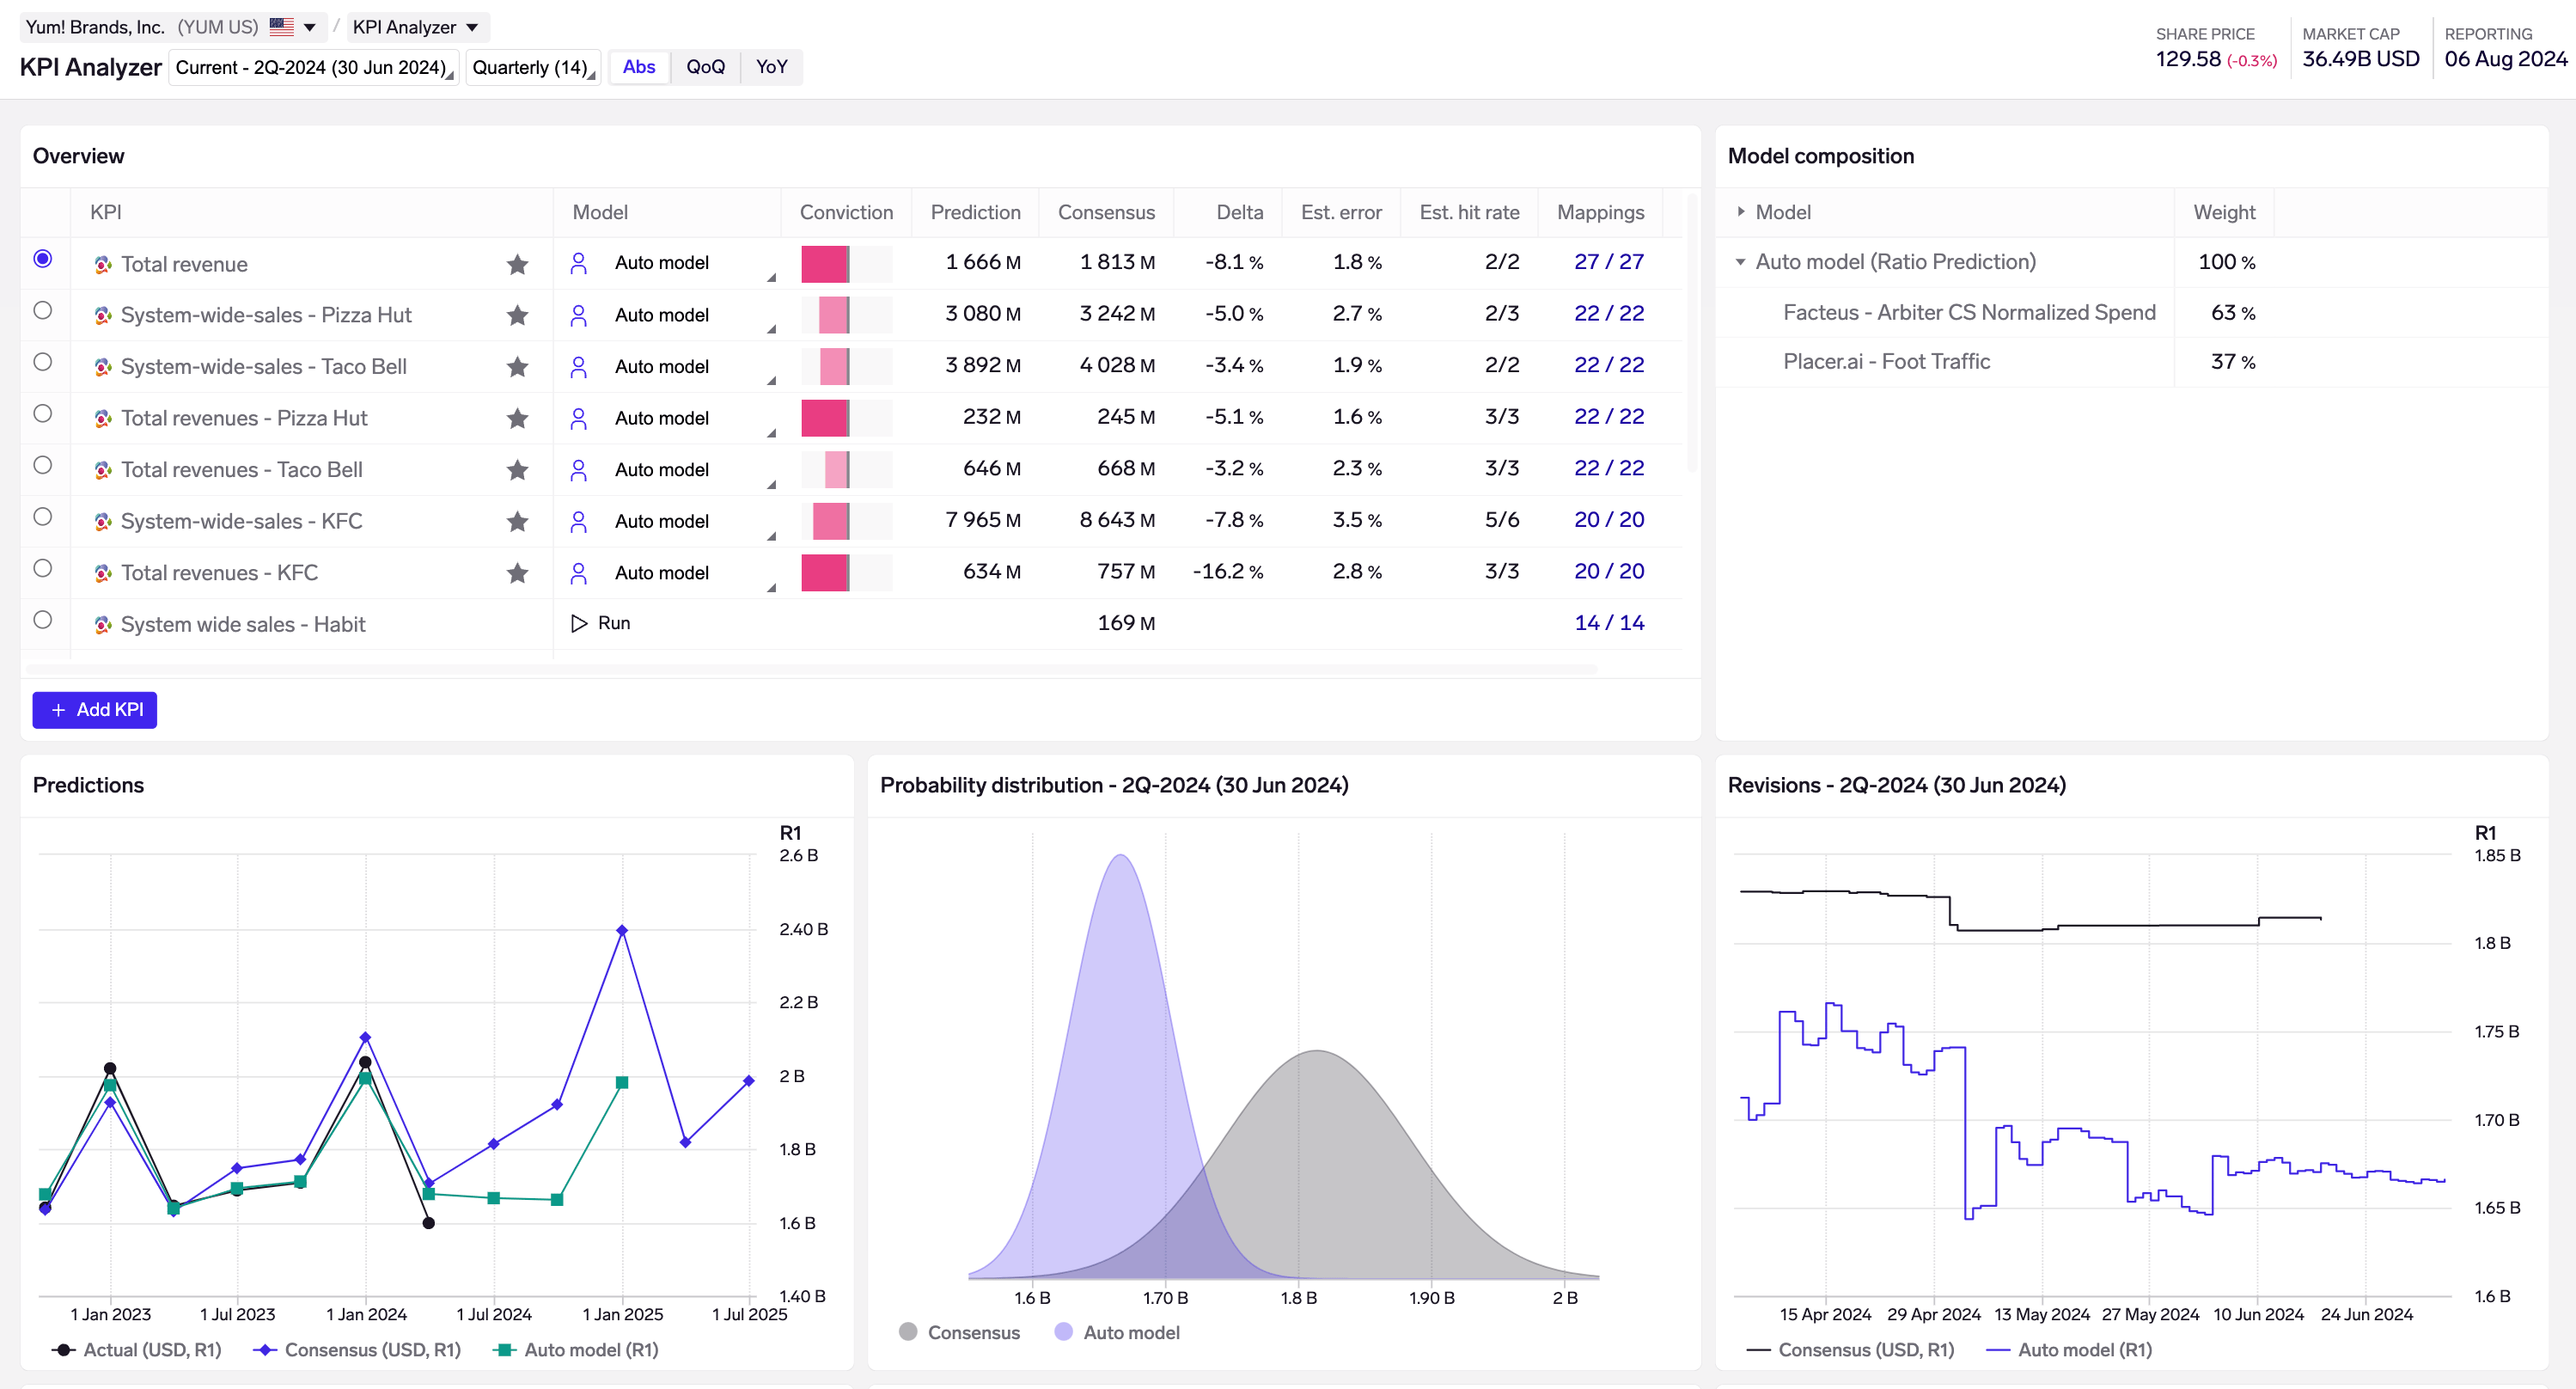
We have introduced a new Conviction column in the KPI Analyzer monitoring views (both single- & multi-company). This is derived by dividing Delta (between model prediction & consensus) by Est. error (of the model prediction), and shown as a graphical green/red indicator to quickly highlight predicted beats/misses respectively. You may mouseover the bar to see the numerical Delta/Error ratio.
Revamped sharing, and KPI model sharing
We have revamped the user interface to allow sharing of your KPI models directly from the KPI Analyzer. Sharing models still involves moving the model into a shared folder, but you can do this now from the KPI Analyzer page, without having to go to the Library.
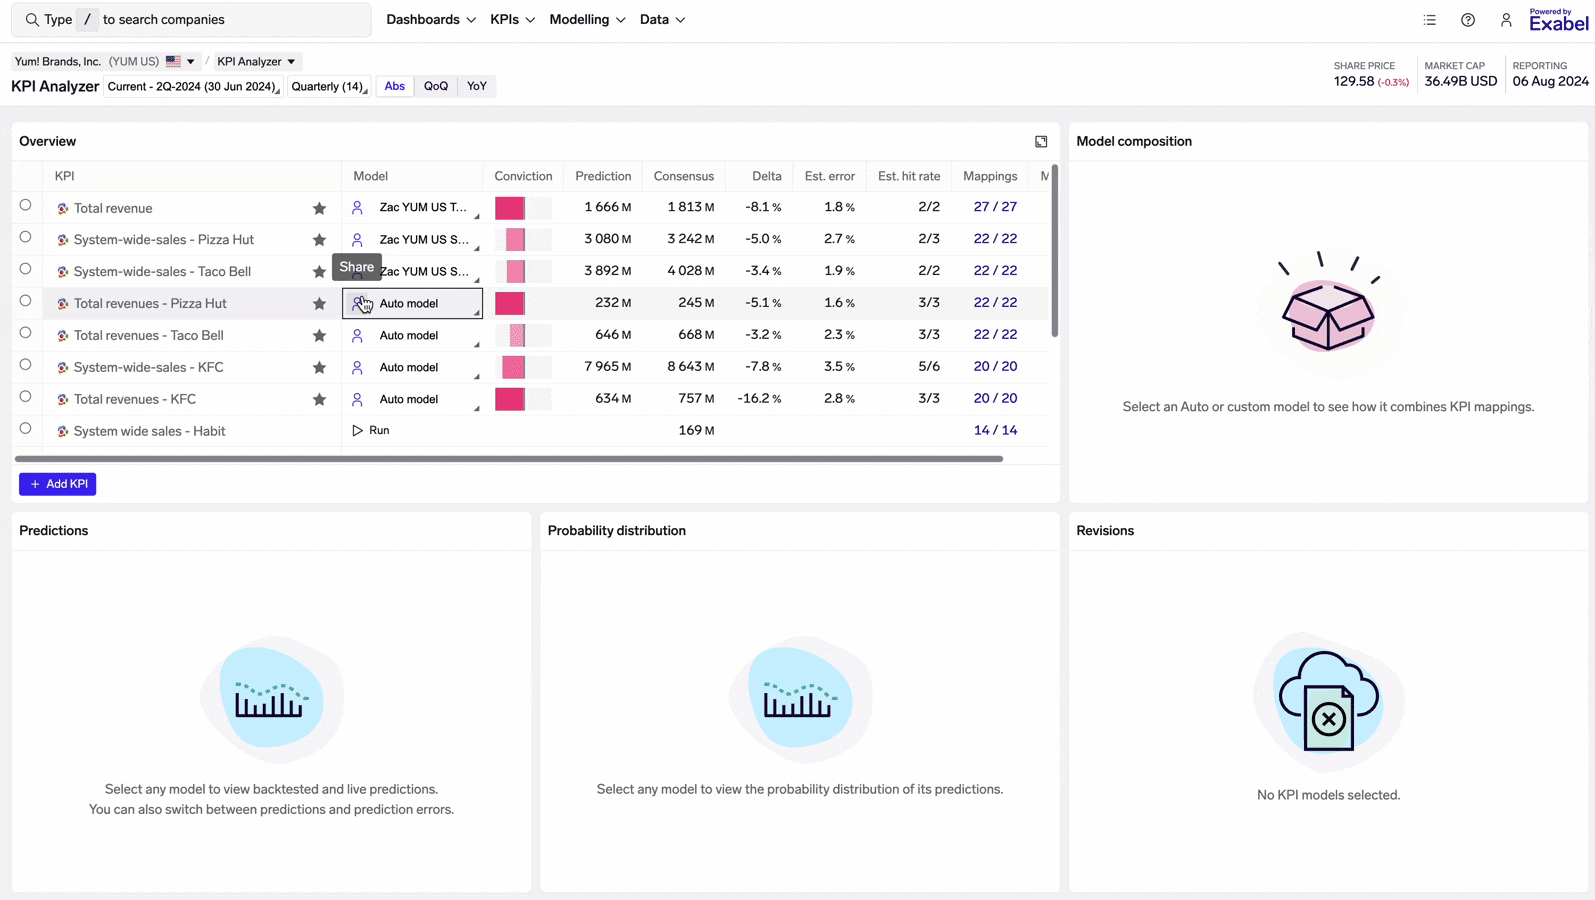
Share models directly from the KPI Analyzer by clicking on the share icon next to the model name
Models may be shared from the Monitoring view, as shown above, as well as in the Models view.
You can also create & share folders directly from the sharing interface.
New KPI model types & customization
We have added support for these additional open-source model types in the KPI Analyzer: ARD Regression, Elastic Net, Elastic Net CV, Huber Regression, Linear Regression.
We have also released a new proprietary Ratio Prediction ML model, which is a machine-learning variant of our proprietary Ratio Prediction model. This is trained on our growing corpus of vendor KPI mappings, and in many cases provide more accurate predictions than the purely statistical methods in the Ratio Prediction model. We are continuing to develop this further, and will publish more detailed results in the near-future.
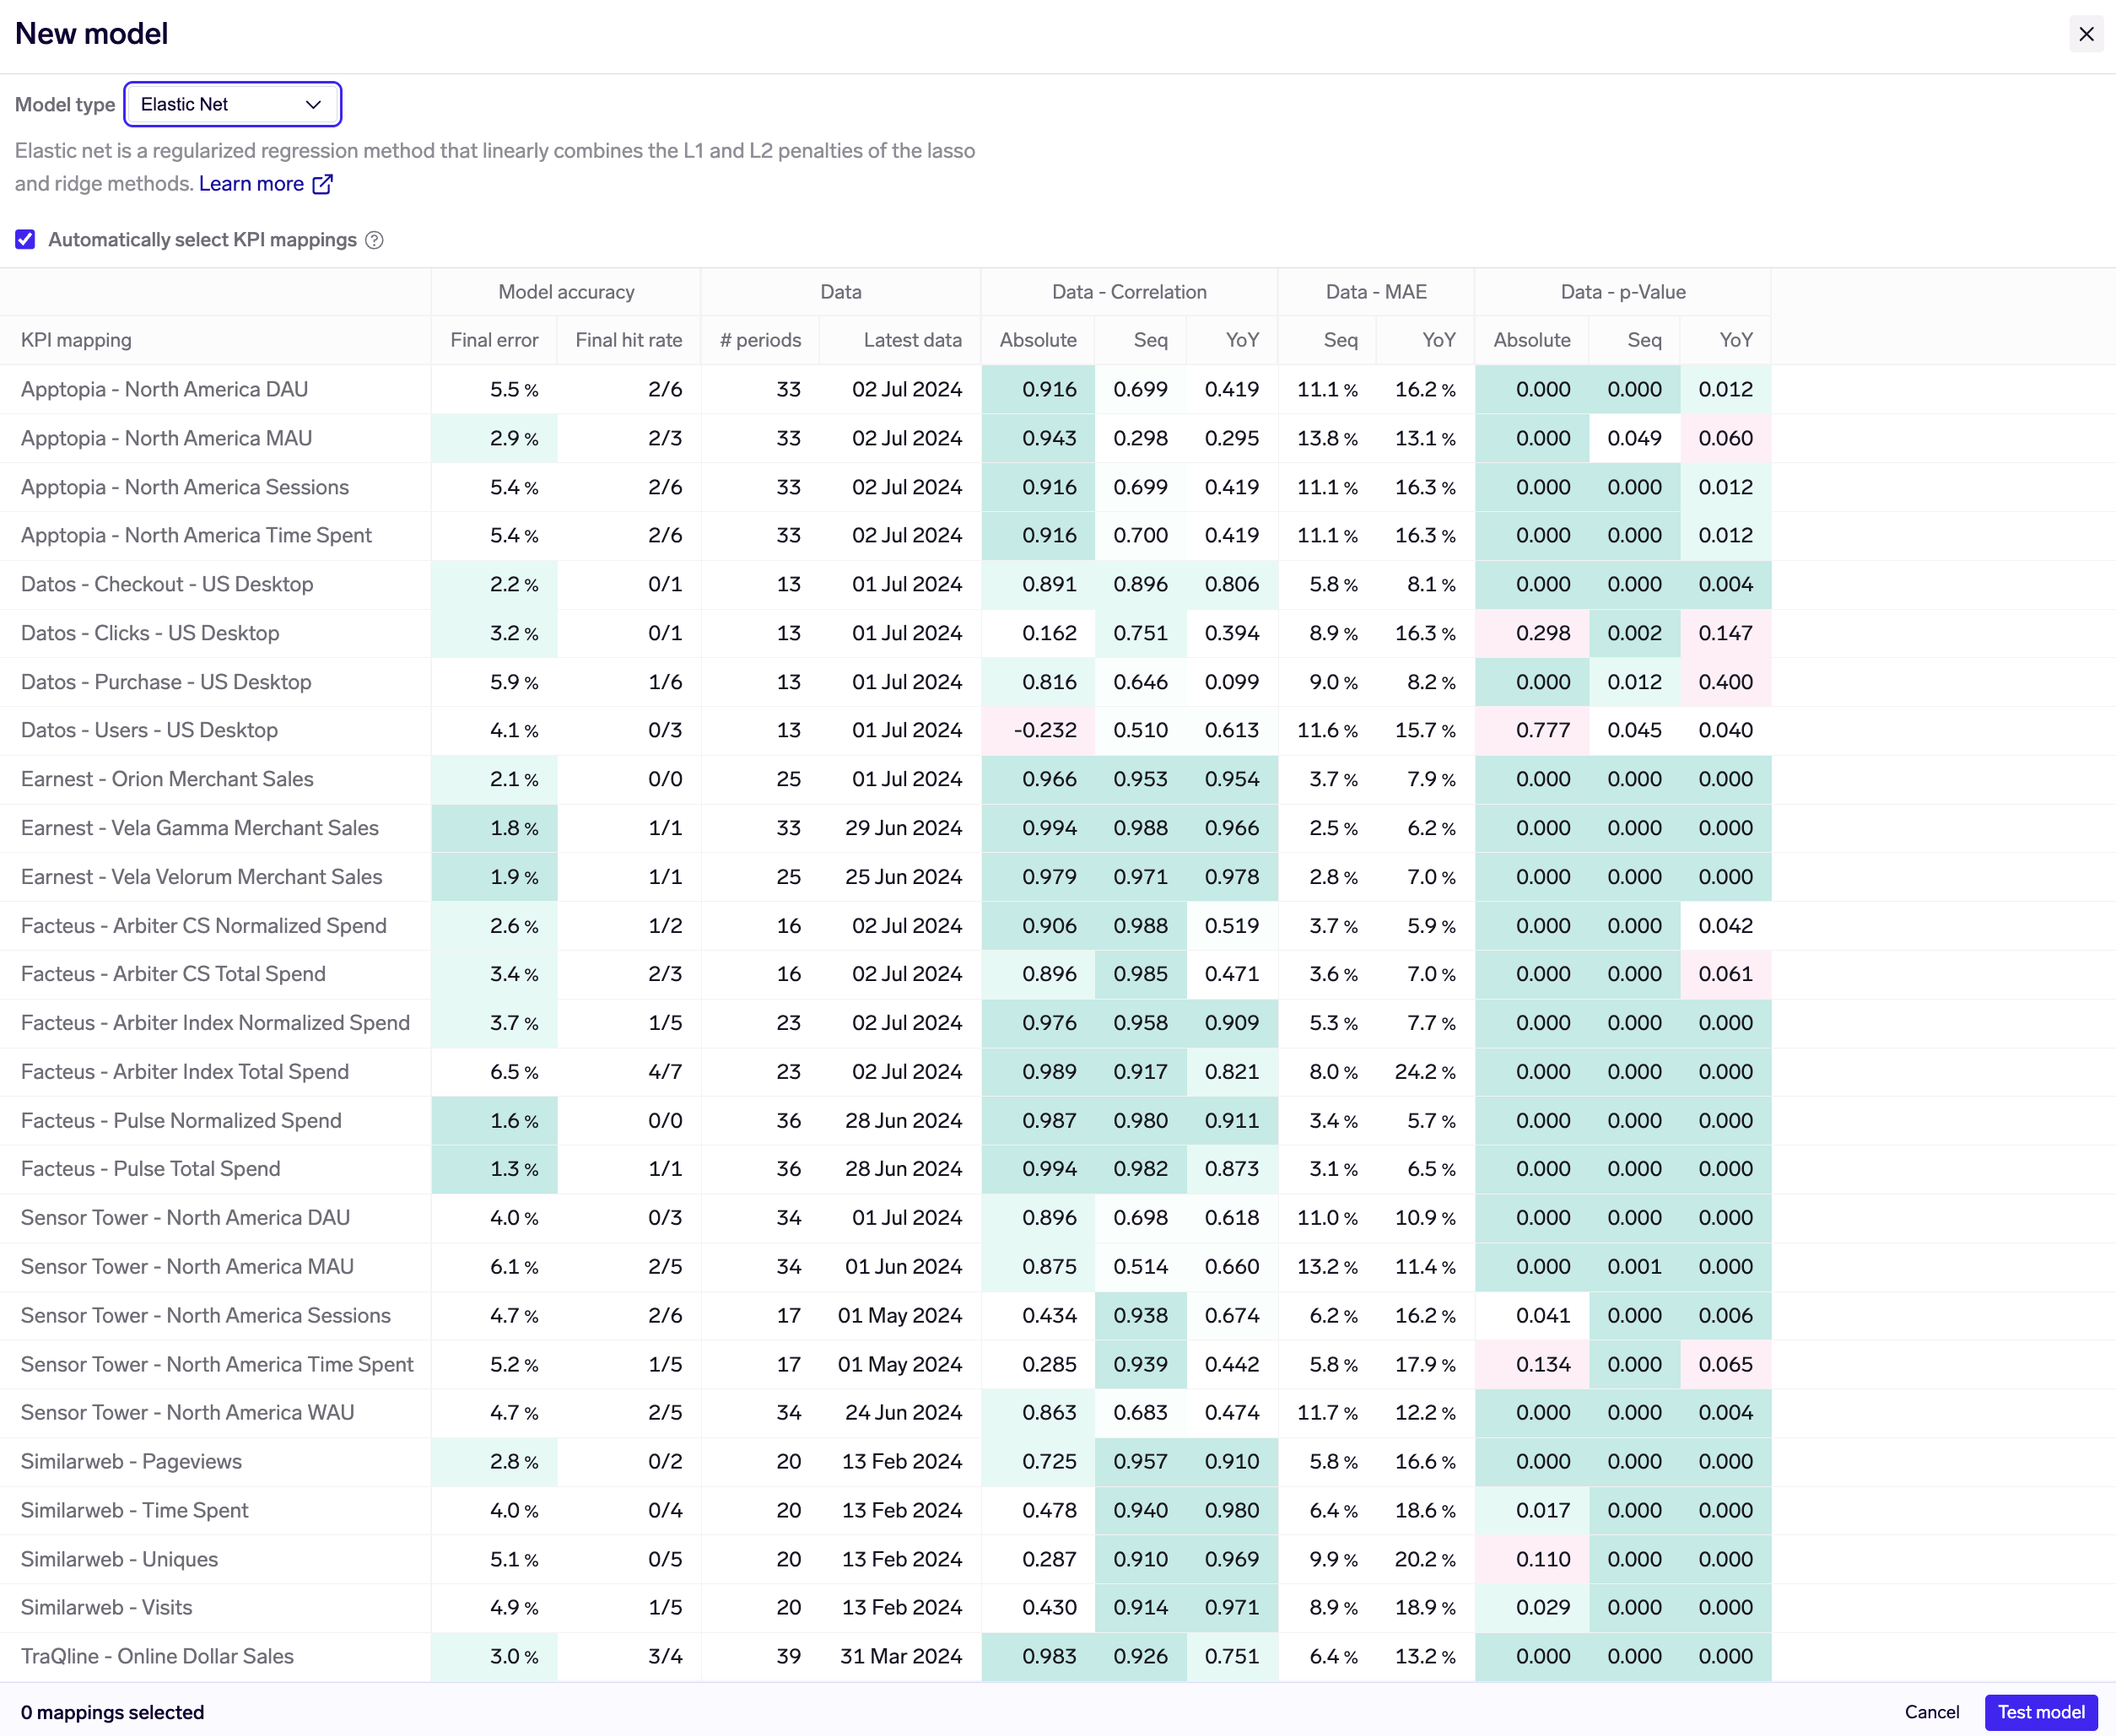
When testing a new model, you can now choose from a large range of open-source and proprietary model types.
There is also a new option to "Automatically select KPI mappings" (see screenshot). When selected, Exabel will optimize the selection and weighting of KPI mappings as inputs into your model. This effectively allows you to create "Auto" models, but with different model types.
Updated "hit rate" definition for KPI models
Previously, the model hit rate was calculated by considering the past 8 quarters on a rolling basis, and counting the instances where the model correctly predicted a beat/miss vs consensus, even if the predicted beat/miss was very small (eg 0.1%). In cases where the predicted delta was very small, which most market participants would consider an in-line prediction, this meant that calling the beat/miss was effectively a coin-flip, making our calculation less useful.
Based on user feedback, we now consider instances only where the model predicts a beat/miss of >3%, with a longer-term plan to allow for customization of this threshold.
As the number of predicted beats/misses in the last 8 quarters may now often be less than 8, we now show the hit rate as a ratio x / y, where x is the number of correctly predicted beats/misses, and y is the number of such calls made. See screenshots above for examples of the new presentation.
Dashboard tables with child rows
Child rows in tables can now be defined by selecting a child entity type. This allows for tables that have companies at the top (parent) level, with child rows representing merchants/apps/etc that are owned by each company.
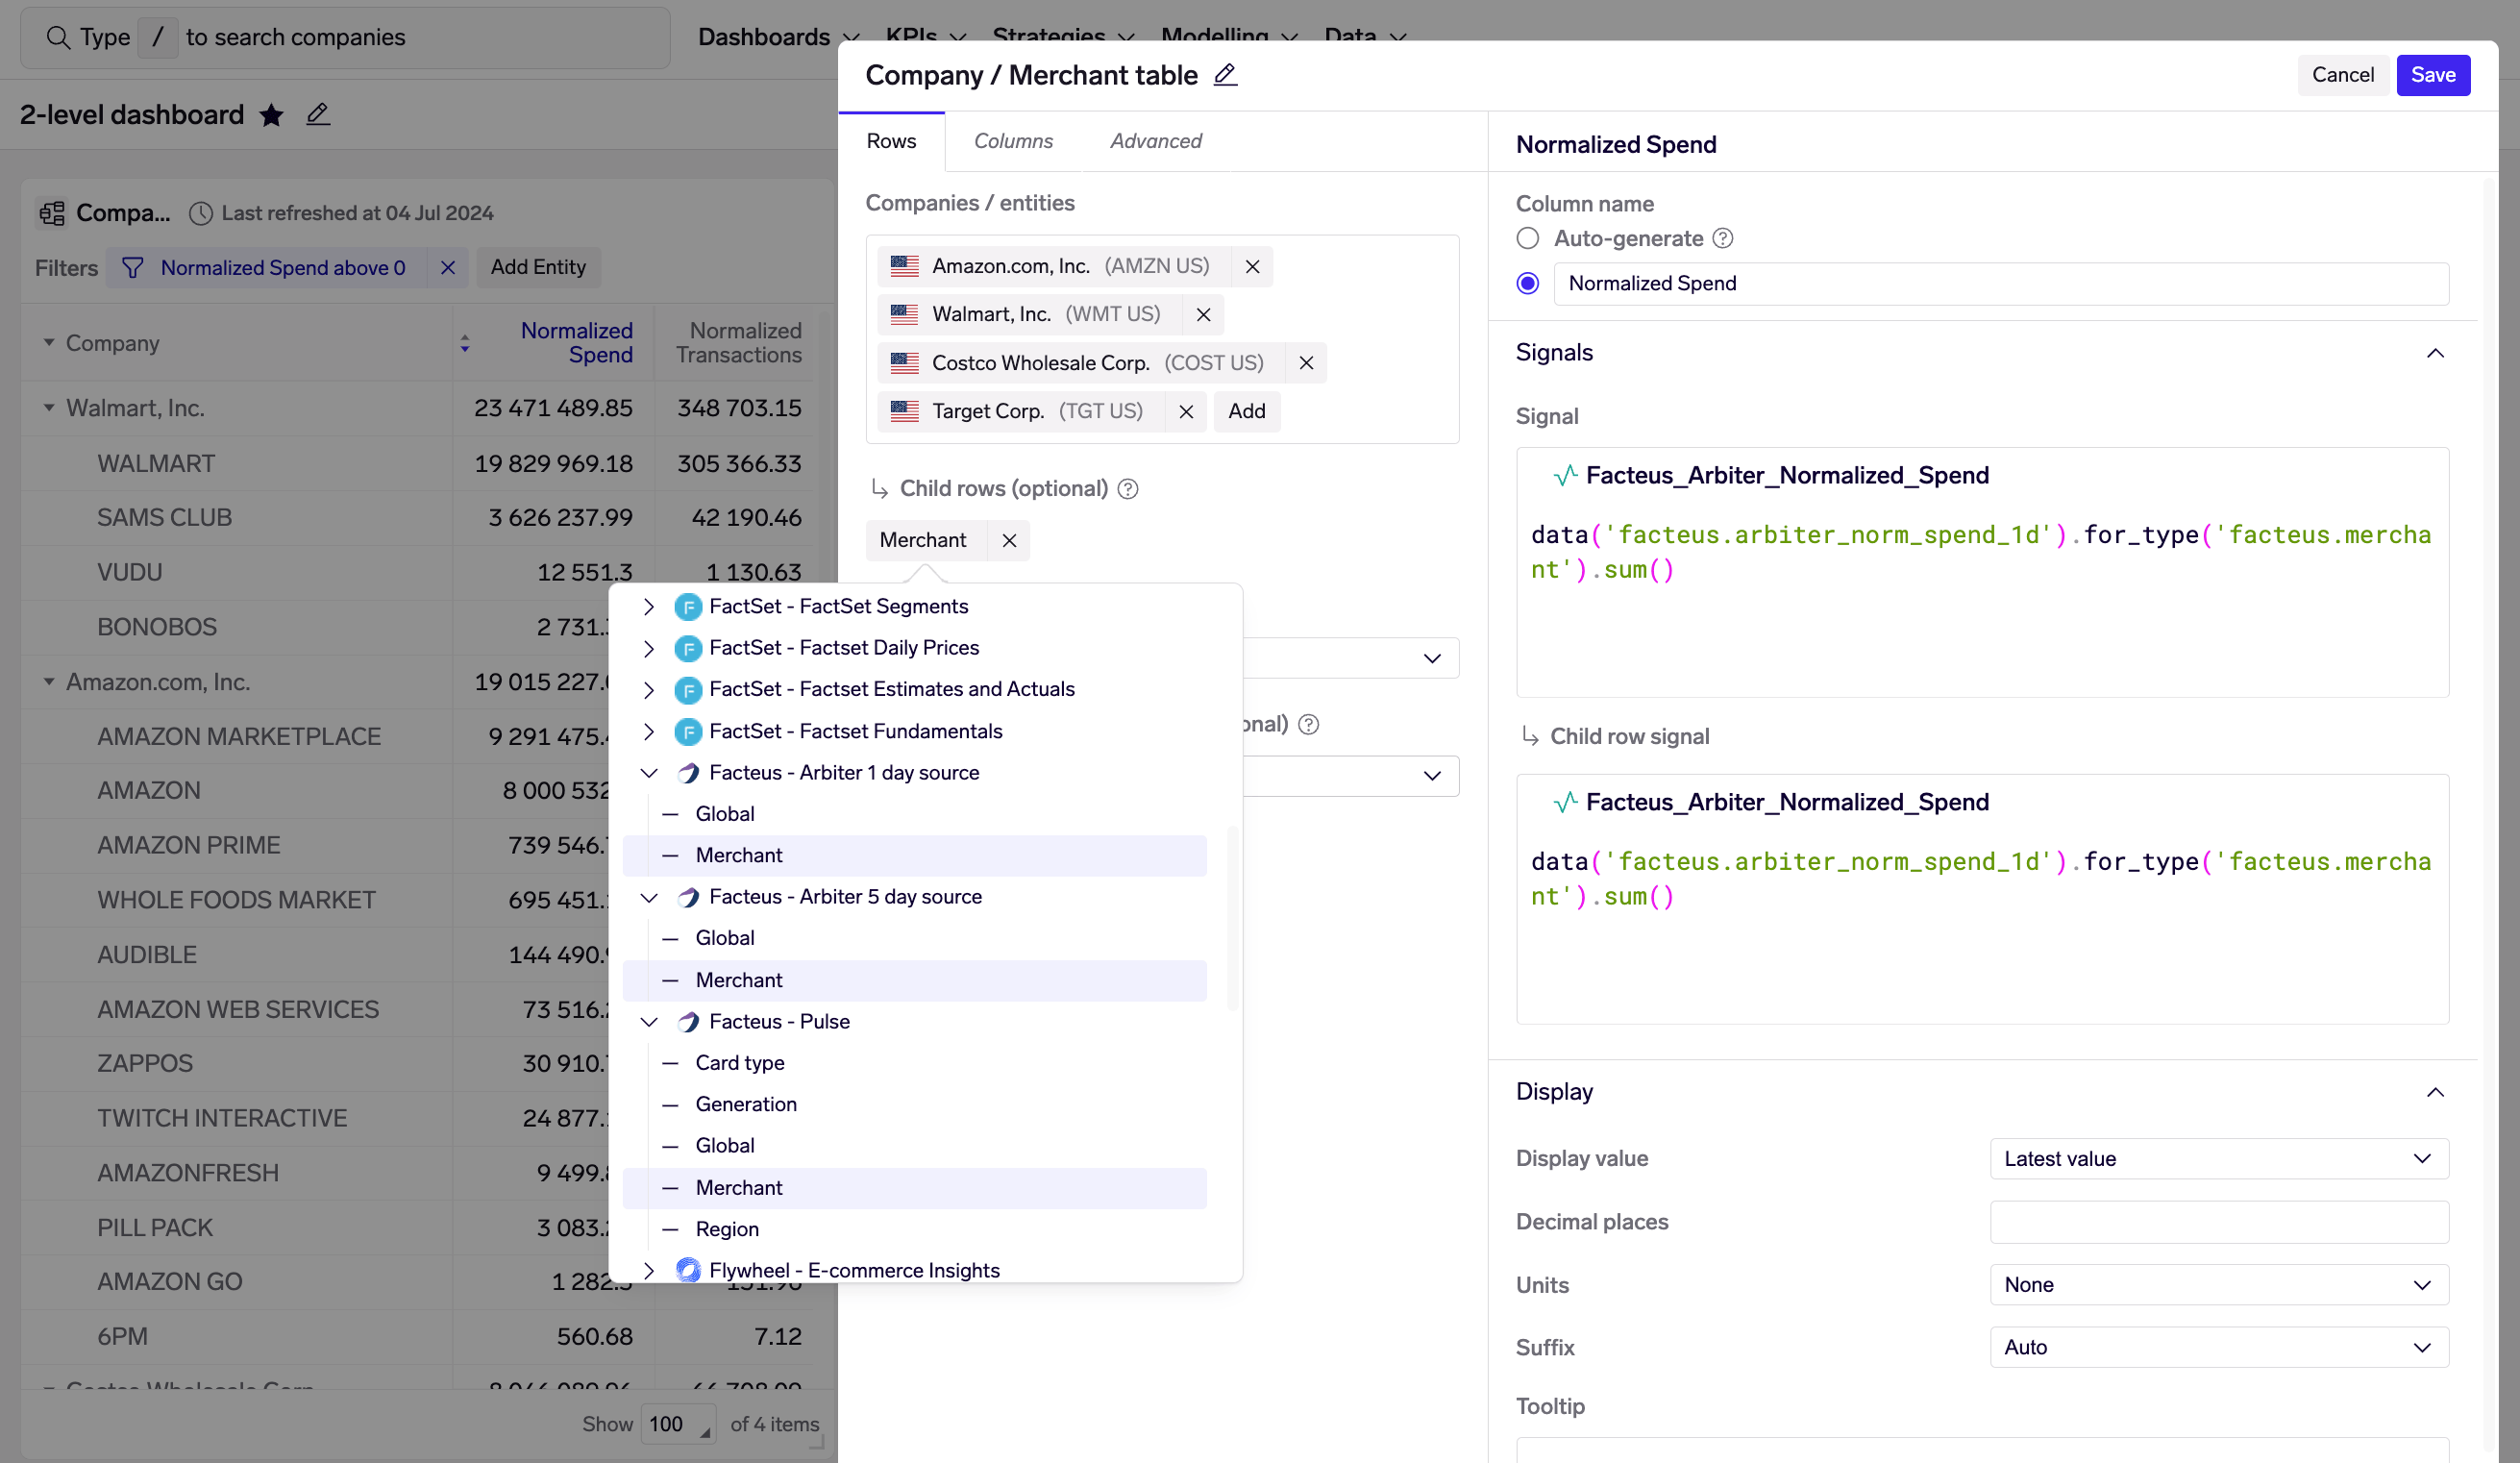
Dashboard table with companies in parent rows and Facteus merchants in child rows.
When child rows are specified, a child row signal must also be set on each column. Exabel allows for different signals on parent and child rows, which is useful for data sets where different entity types may require different signals.
Other new features
- Alerts: Alerts are now available in the user's personal folder in the library, and can be shared with other users by moving to a shared folder, or by sharing your personal folder. We are working on a revamped alerting interface, and will showcase this along with the sharing changes in the near-future.
- KPI Mapper: Support mapping to KPI proxies that are pre-calculated predictions.
- Import jobs: Support key-pair authentication for Snowflake.
Improvements
- KPI Analyzer: Backtest revisions are now plotted for the selected period in the revisions chart.
- KPI Analyzer: Added heatmap to the error and hit rate columns in the Mappings view.
- KPI Analyzer: Added more tooltips to column headers to better explain the metrics shown.
- KPI Analyzer: Table columns have been compacted to display more data in overviews.
- KPI Analyzer: Optimized retrieving data for faster display.
- KPI Analyzer: Removed the floating toolbar with links to mappings and models, as it was commonly obscuring the prediction columns.
- KPI Analyzer: Changed hit rate display to a ratio showing the number of "calls" (beat/miss) made, and the number of times a correct beat/miss call was made.
- KPI Analyzer: Added descriptions of model types when training a custom model.
- KPI Mapper: The results view can now be filtered and sorted on model accuracy, correlation, MAE and p-value.
- Data Explorer: Automatically expand the first company in each data set to streamline data exploration.
- Library: Show KPI and company for KPI models, and change the Open link to open the model in KPI Analyzer.
- Company pages: Disabled refresh on tab focus to avoid losing selected time series in Data Explorer, and unsaved models or mappings in KPI Analyzer.
- Data API: Support for marking time series as ratios. See field units of Create time series or Update time series for details.
- Python SDK: Released versions 5.2.0 through 5.3.0, which add additional logging for help with debugging slow data imports, and support for Snowflake key-pair authentication.
Bug fixes
- KPI Analyzer: Fixed missing delete action for shared models where user has write-access.
- KPI Analyzer: Fixed an issue where the KPI button could show a different KPI than the one actually picked when creating new KPI mappings.
- KPI Analyzer: Fixed an issue where some columns were not updated when selecting another period (last/current/next).
- KPI Analyzer: Fixed non-subscribed vendor mappings not scrolling correctly on smaller screens.
- Charts: Fixed an issue where a line could be missing from charts when copying or downloading if a custom color was not set.
- Signal Explorer: Disabled download button when only viewing non-exportable data, instead of giving a non-descriptive error message.
- Signal Explorer/Library: Avoid overwriting signal expression when editing a signal in the Library view.
- Alpha Tester: Fixed an issue where some browser would not load more than 25 alpha tests when scrolling.