May 2025 update
We’re excited to roll out KPI alerts, saved KPI screens, cohort analysis, and a host of usability improvements across dashboards, charts, and the KPI Analyzer - making it easier than ever to uncover investment insights from your alternative data.
New features
KPI alerts and saved screens
We recently launched a new KPI alerts feature, that allows you to setup and automatically receive alerts on predicted KPI beats/misses, as well as significant revisions in KPI model predictions.
In order to do this, you'll first have to set up and save a screen in the KPI Screener. Then, click on the Alerts tab and configure when you want to be alerted, and optionally choose if you want to receive email digests (summaries) of the KPI alerts.
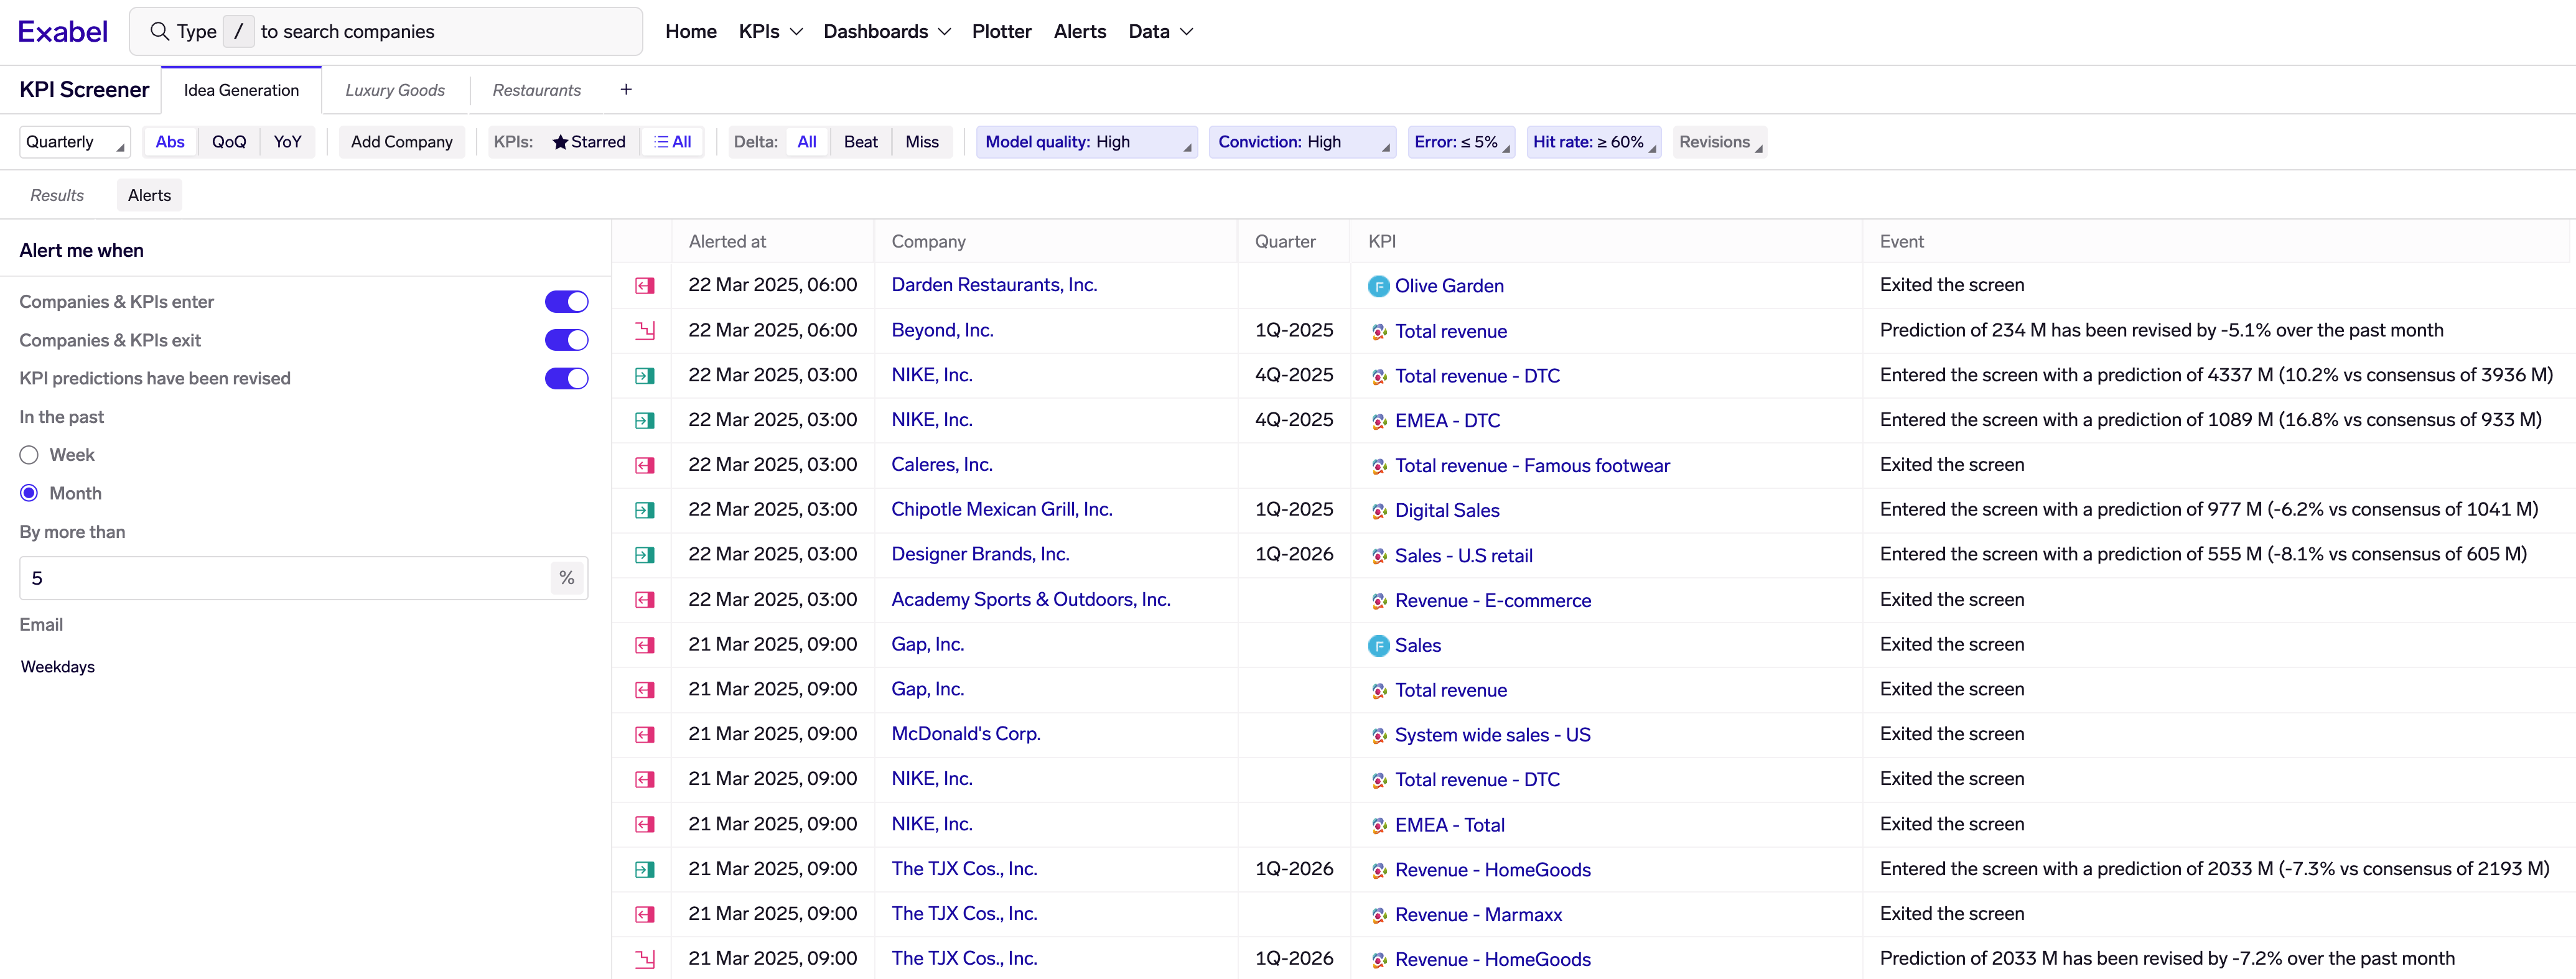
KPI Screener with saved screens in tabs. Alert settings are on the left, and recent alerts are shown on the right.
If you have existing data alerts and email digests for those alerts, you can set your KPI alerts to be added to the same emails. Your alert email will then contain both KPI alerts and data alerts.
As part of this feature, we now also allow saving multiple KPI screens. This will allow you to have separate screens for your portfolio, idea generation, and/or sector-specific screens.
Cohort analysis charts
Alternative data has significant value in deeper fundamental analysis of company performance, beyond KPI modelling. A good example is cohort analysis, which allows us to examine how different cohorts of customers over time are retaining (or churning).
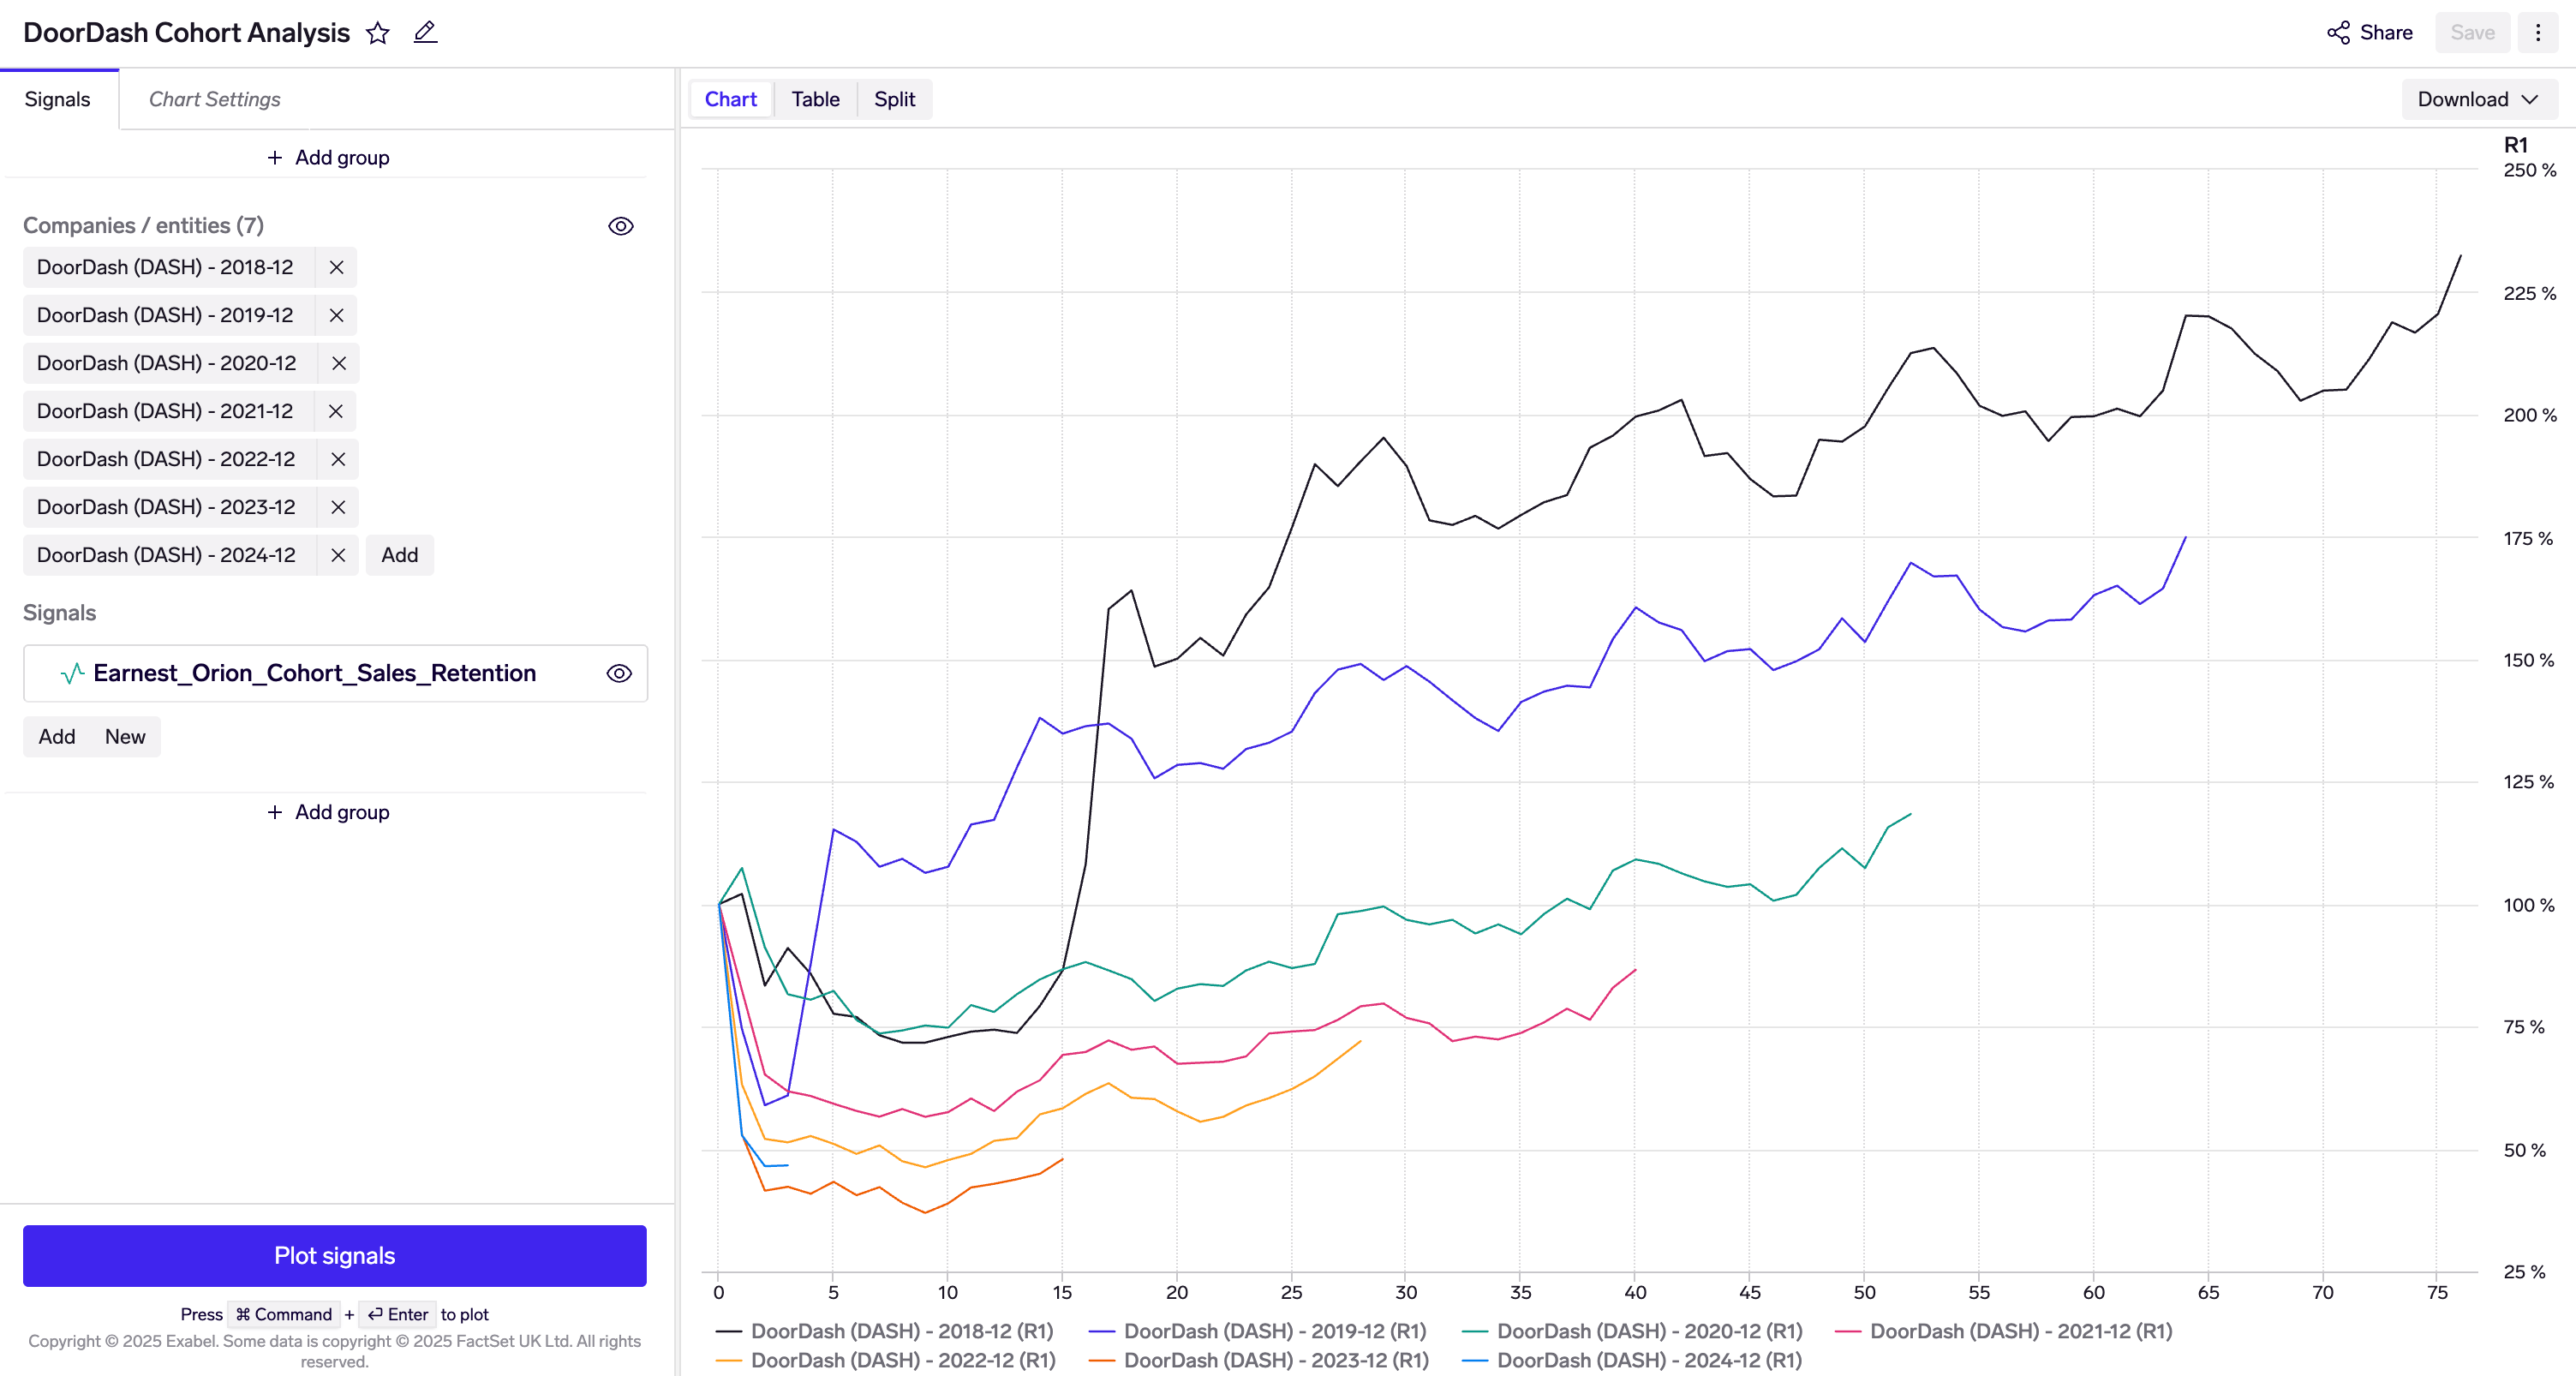
Cohort analysis of customer spend at DoorDash. We observe that more recent cohorts have shown weaker net spend retention than earlier cohorts. (Source: Earnest Analytics)
To do cohort analysis, open Plotter and choose the "Cohort" chart type. Companies/entities and signals can be selected as normal. The chart will be plotted with the x-axis being the number of periods (days/weeks/months) from the start of the cohort.
Note that you should plot signals with the same frequency on one chart - e.g. if you want to do monthly cohort analysis, then all signals in your chart should return monthly data.
Cohort charts can be saved and added to dashboards like all other charts.
Cohort data is currently available for Consumer Edge (Transact USA) & Earnest (Orion, Vela Gamma, Vela Velorum) data sets, with more coming soon (this is dependent on vendors providing cohort data).
Improvements
- Overall: Improved UI scaling on mobile devices.
- Watchlists
- It is now possible to clear a watchlist, rather than remove companies one by one.
- It is now possible to replace a watchlist when uploading a file with tickers, rather than appending the tickers to the existing watchlist.
- KPI Analyzer
- Improved UI responsiveness when selecting KPIs to view results.
- Company-specific mappings can edited directly from the KPI Analyzer's mapping view, if you have write-access to the KPI mapping.
- It is now possible to override the proxy entity when copying KPI mappings.
- Added missing tooltips for several columns in various tables.
- Added explanation for the "Baseline" in model composition.
- KPI Screener: Filter out operating expense KPIs by default, as beats/misses on such KPIs are usually not very relevant for screening.
- Plotter / Charts
- Improved loading performance by caching chart series in various features such as KPI Analyzer and Data Explorer.
- Improved snapping behaviour on time series charts, making it easier to hover over the desired data point and see the tooltip.
- It is now possible to configure plotlines (thicker horizontal lines) on y-axes. For example, if plotting a YoY% chart, adding a plotline at y=0 can help better denote positive vs negative YoY growth.
- Added minimum and maximum as cross-sectional aggregation methods.
- Data Explorer
- More prominent Open-in-Plotter link in the sidebar.
- Prefix customer data sets with the customer name.
- Data Trends
- Add a shortcut for each data set in the sidebar, making it easier to jump to charts for that data set.
- Optimized page to avoid reloading all charts when toggling data sets or metrics on/off.
- Add a new table view of the chart data.
- Support maximizing charts to full screen.
- Dashboards
- Always allow editing and removing table widgets, even when they are being calculated for the first time.
- Improve rendering performance of large dashboard tables, in particular on Microsoft Edge.
- Store table pagination size in user settings.
- Alerts: Improved the alert time picker to make it more intuitive.
- Entity picker: Now remembers the last selected entity type, reducing number of clicks when selecting the entities from the same entity type repeatedly.
- DSL: Added
minandmaxmethods to thecross_section()function. For more information, see Cross-sectional aggregation. - Import Jobs: Increased the maximum PiT offset to 100 days, to handle loading time series with larger historical delivery lags.
- New release of the Python SDK: Version 6.2.0, support the increased maximum PIT offset as well as extended limit for raw signal names (128 vs 64 characters).
- Analytics API: Added new service
KpiServicethat can be used to retrieve KPI Mapping results. For more information, see List KPI mapping results.
Bug fixes
- Watchlists: Fix issue when searching to add watchlists in features such as Plotter, and only a limited number of results are returned.
- Company pages: Fix broken market data section in the header when there is no designated FactSet sector.
- KPI Analyzer: Fixed issue where revisions chart did not show the actual reported value for semi-annual companies, in limited cases.
- KPI Analyzer: Fix missing company sector when viewing models.
- KPI Analyzer: Fix transient error when a new KPI mapping, which also happens to be selected, is saved.
- KPI Analyzer: Avoid resetting the dialog for searching & adding new KPIs, if models are running in the background.
- KPI Screener: Fixed issue where filters were not editable while a screen was loading.
- KPI Mapper: Hide delete action for KPI mapping collections which the user cannot edit. (Previously, clicking this would generate an error.)
- KPI Mapper: Fix bug causing an error when filtering on backtest error.
- Dashboards: Show the error message if the initial table calculation fails.
- Dashboards: Fix bug where the sync signal was not set on the child level, in 2-level dashboard tables.
- Dashboards: Fix missing widget resize handles on editable dashboards.
- Dashboards: Fixed incorrect height sizing of dashboard widgets.