October 2023 update
In the past 2 months, we've rolled out several exciting features. Firstly, there's a sleek new company page providing comprehensive insights, including KPI analysis, vendor coverage, and quick links to drill-downs and financial models. We've revamped the KPI Analyzer to make it easier to monitor and predict KPIs, and introduced Auto models that combine data from all your KPI mappings to improve prediction accuracy. Additionally, we've introduced data set tags for efficient data management, and made various enhancements and bug fixes. Check out the full details below.
New features
New company page
We have introduced new company overview pages that summarize the most pertinent information about any company you search for, including KPI analysis, vendor coverage, and available drill-down and financial model views.
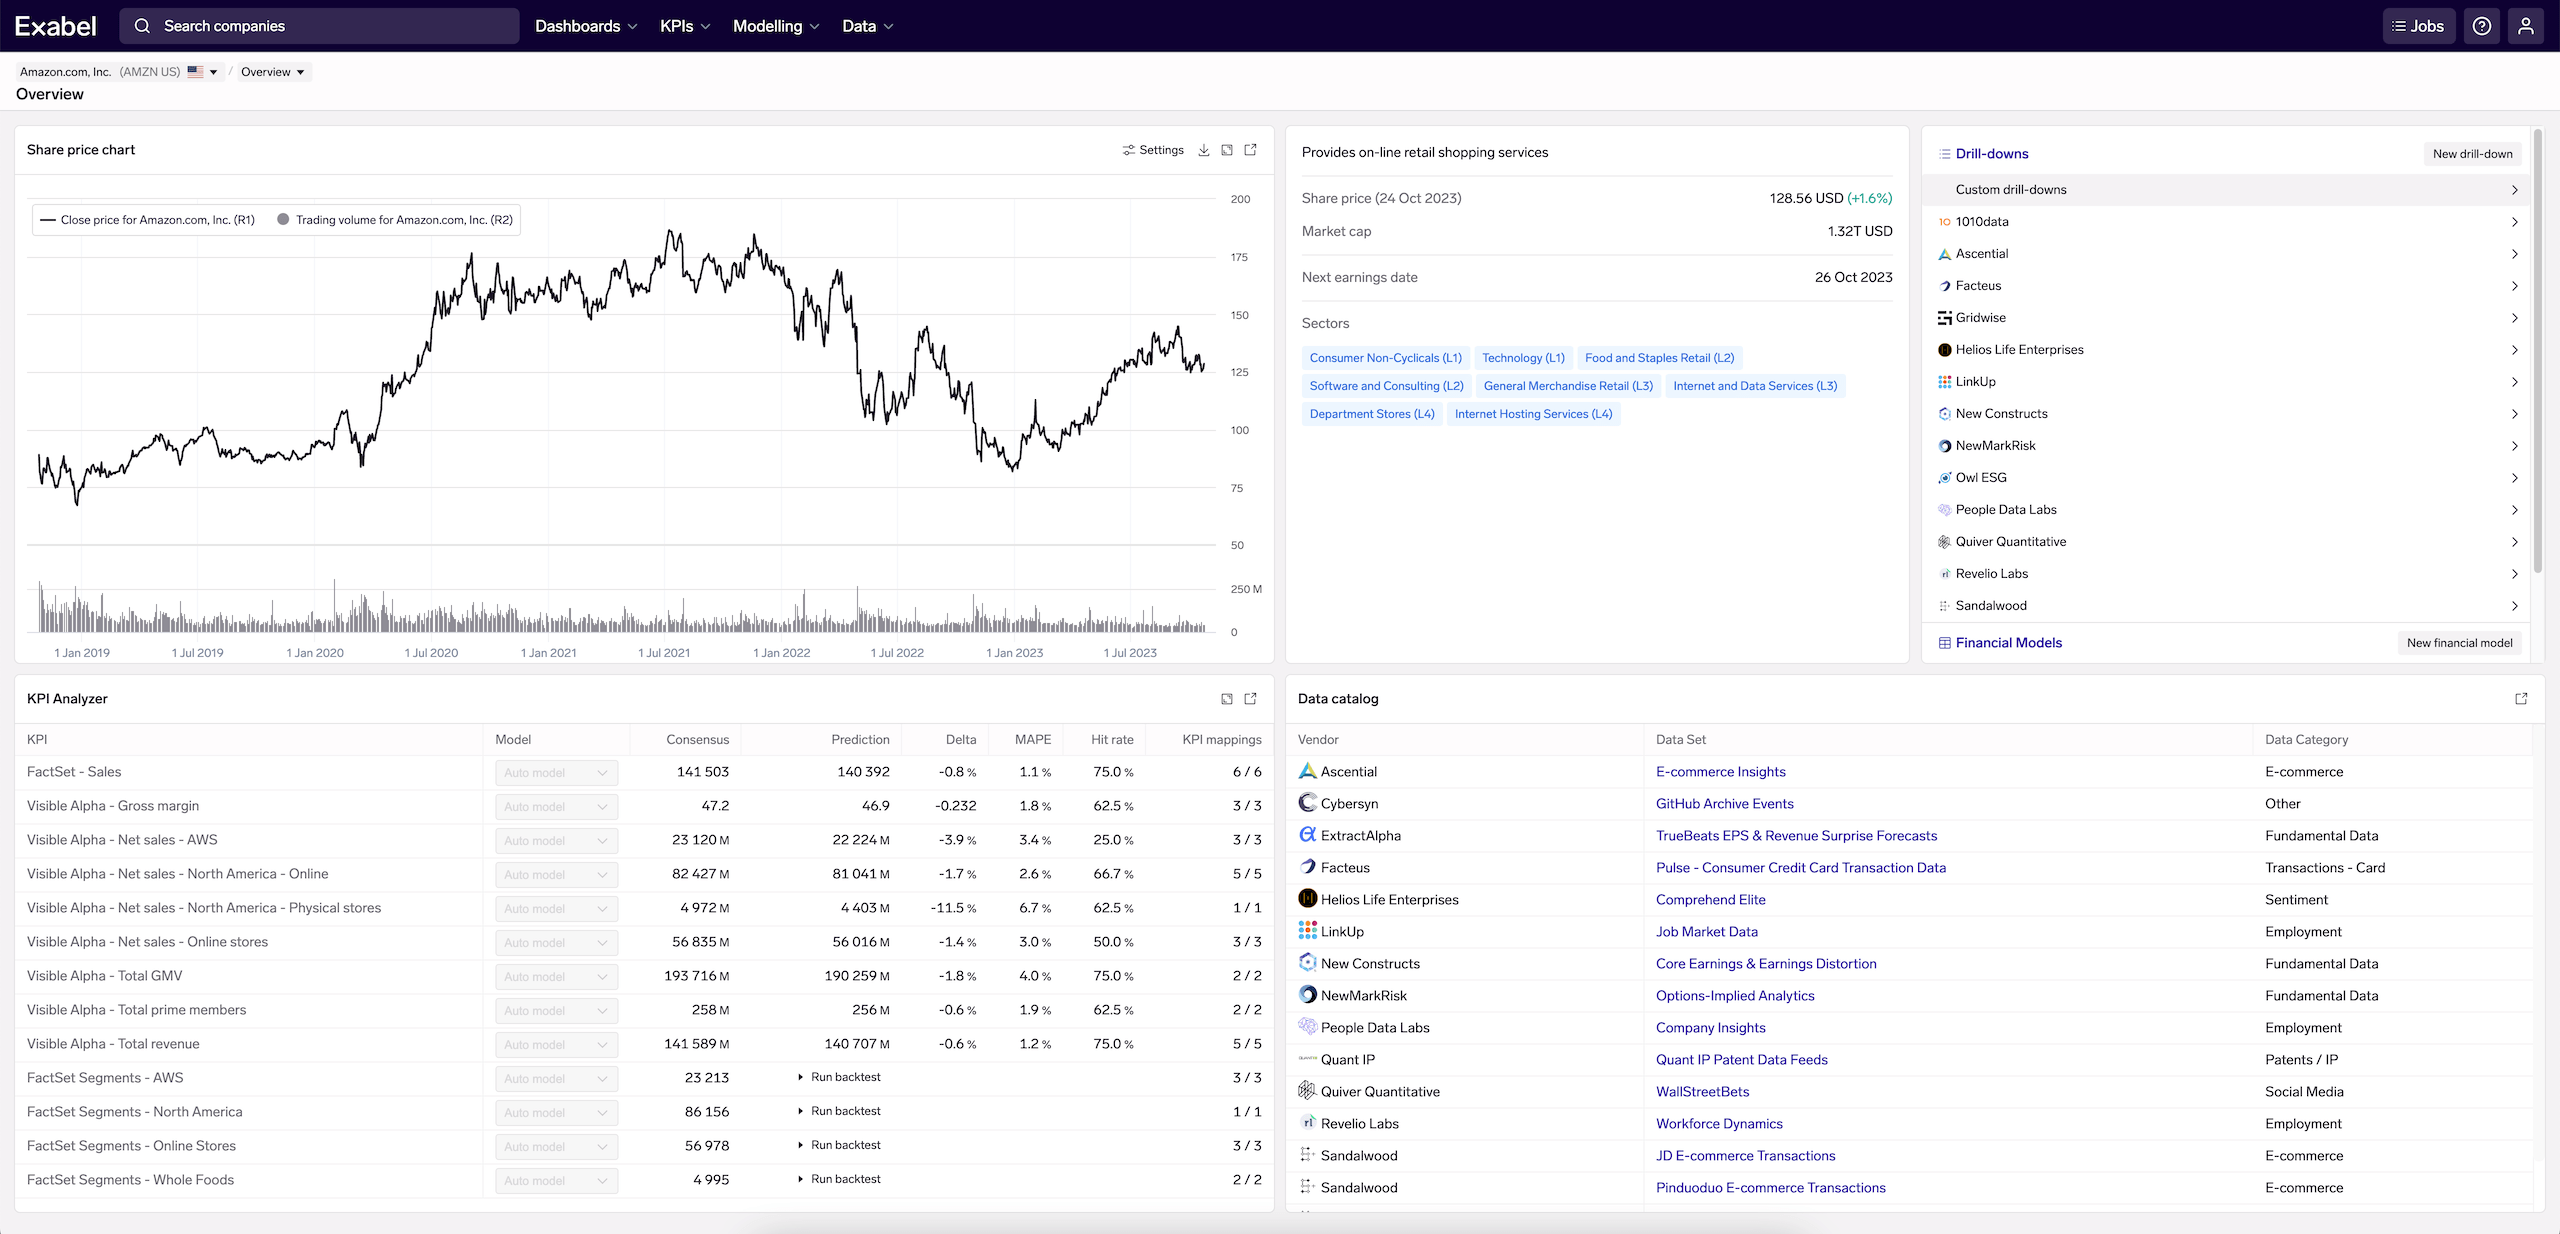
Amazon, Inc. company page, showing KPI analysis, vendor coverage & drill-down/financial model views, and general market data
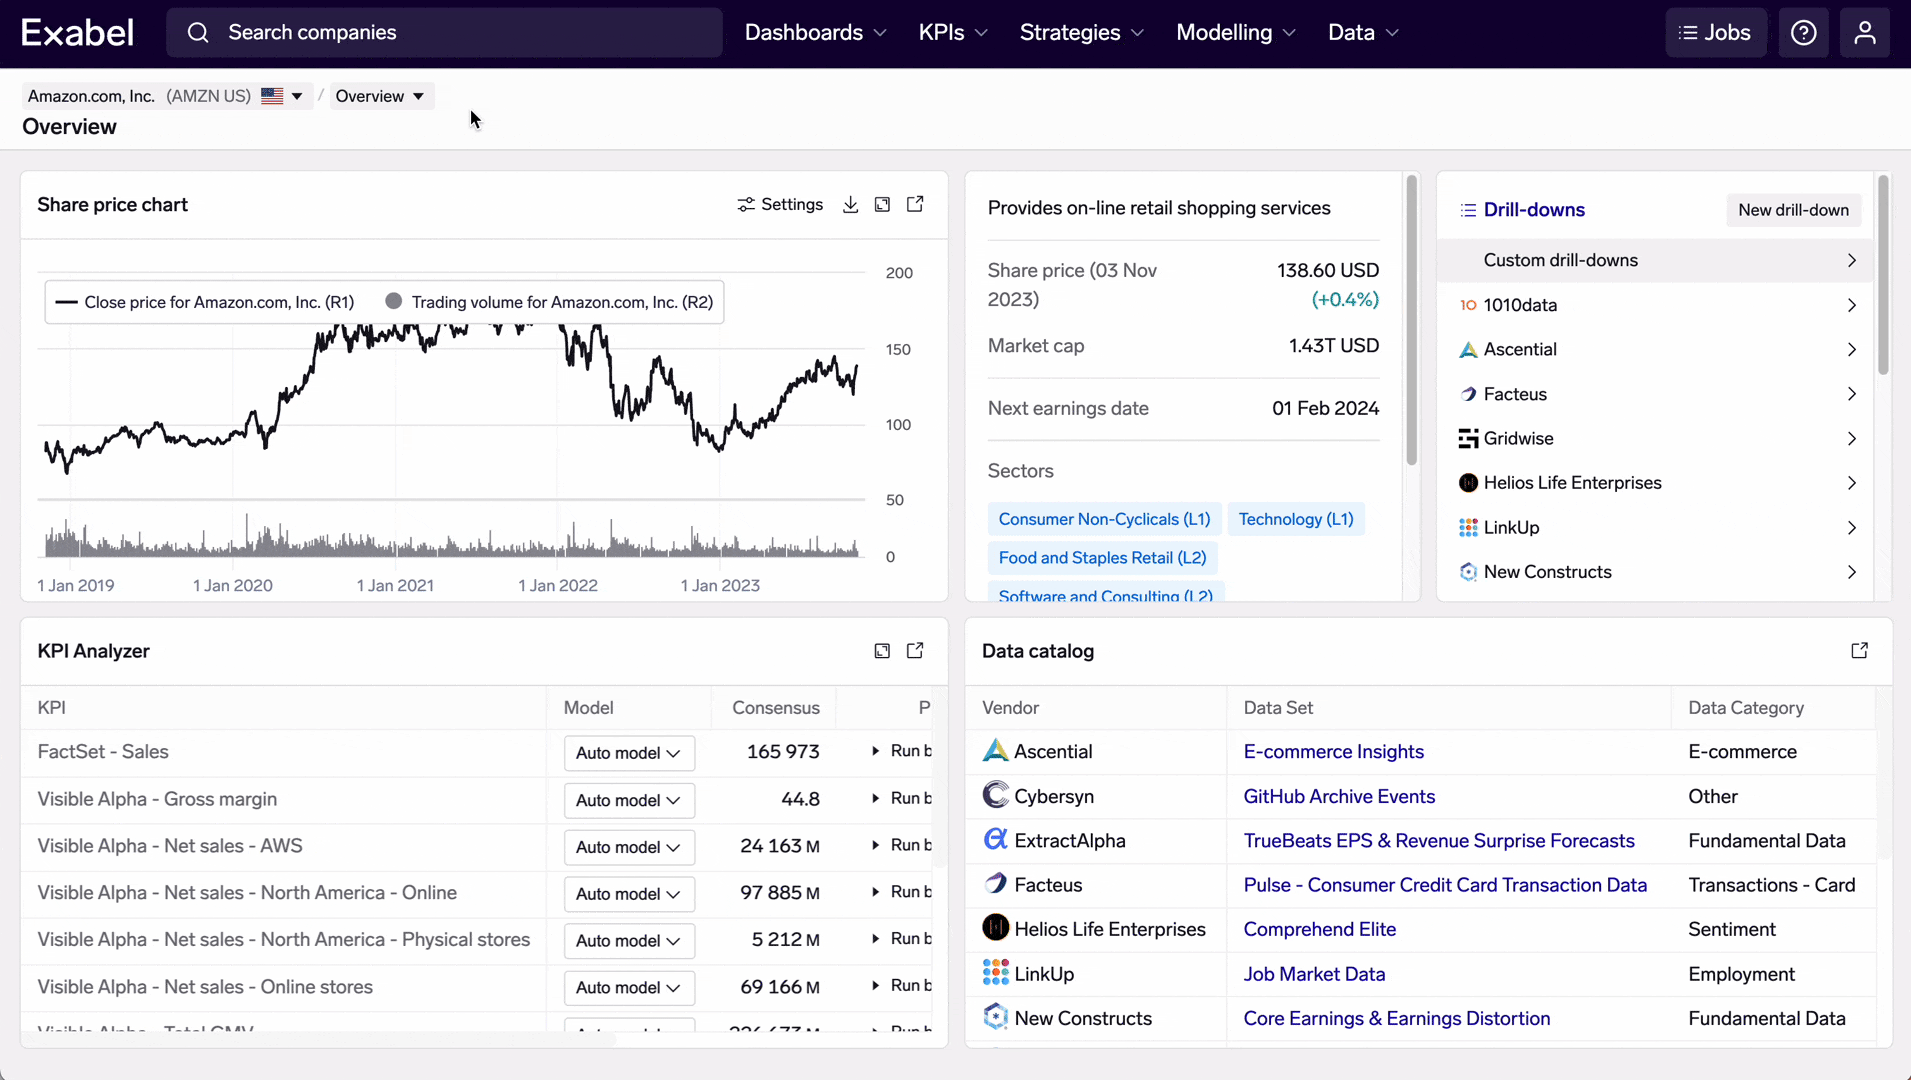
Updated KPI Analyzer
We have redesigned the KPI Analyzer and incorporated it as a view in the new company pages. Monitor all the relevant KPIs for a given company, deep-dive into the available KPI mappings (configured in the KPI Mapper), and train & track prediction models that combine multiple vendors' to make the best predictions for a KPI.
To navigate to the KPI Analyzer, simply click use the dropdown at the top of the page to switch views to the KPI Analyzer, or click the link icon on the KPI Analyzer widget in the company page:
Prediction models in the KPI Analyzer
The new KPI Analyzer automatically runs prediction models on KPI mappings you have access to - across both your own KPI mappings as well as those made available through vendor subscriptions.
To view model predictions and details on model performance (mean error, hit rate, etc), go to the KPI Analyzer for your company of interest, select a KPI and click "View models".
This Prediction view shows all prediction models available for your selected company & KPI.
- Each KPI mapping produces a standalone model that uses only that KPI mapping to predict the KPI
- As long as you have data from at least 1 KPI mapping, you will also see the Auto model that automatically combines all of your KPI mappings to produce a combined model. This smartly assigns weights to each predictor (KPI mapping) based on its standalone accuracy.
All models are trained and evaluated based on a rigorous walk-forward backtesting process. The primary accuracy metrics we produce are the MAE, MAPE and hit rate.
Model accuracy metricsMAE (mean absolute error): calculated by taking the difference between the prediction and actual value for each backtested period, and calculating the mean across all backtested periods.
MAPE (mean absolute percent error): same as MAE, except calculated as the percent difference between the prediction and actual value.
Hit rate: for each backtest period, we consider if the model predicted a beat or miss vs consensus, and consider it a "hit" if the reported KPI was a beat/miss as predicted. We then report the hit rate as the percent of the time the model correctly predicted beat/miss, over all backtested periods.
Selecting 1 or more models in the table also allows you to visualize historical backtested predictions as well as predictions for the upcoming and future periods.
Coming soon - custom modelsWe are working on custom models that allow users to choose which KPI mappings to include in the model, and to configure model settings to optimize model performance.
Data set tags
Data set tags are tags that always contain all of a data set's entities of a given type. For example, if looking at a data vendor data set (e.g. Ascential E-commerce Insights), data set tags are available for each entity type (company, retailer, etc). They are also available for customers' own data sets that have been created via the Data API.
Data set tags are helpful when trying to work with data across an entire data set, for example:
- Creating a dashboard table with all companies in a data set
- Evaluating a credit card signal across all merchants in a data set, and summing across all of them
- Creating a bulk KPI mapping that maps a vendor signal to revenue, for all companies in that vendor data set
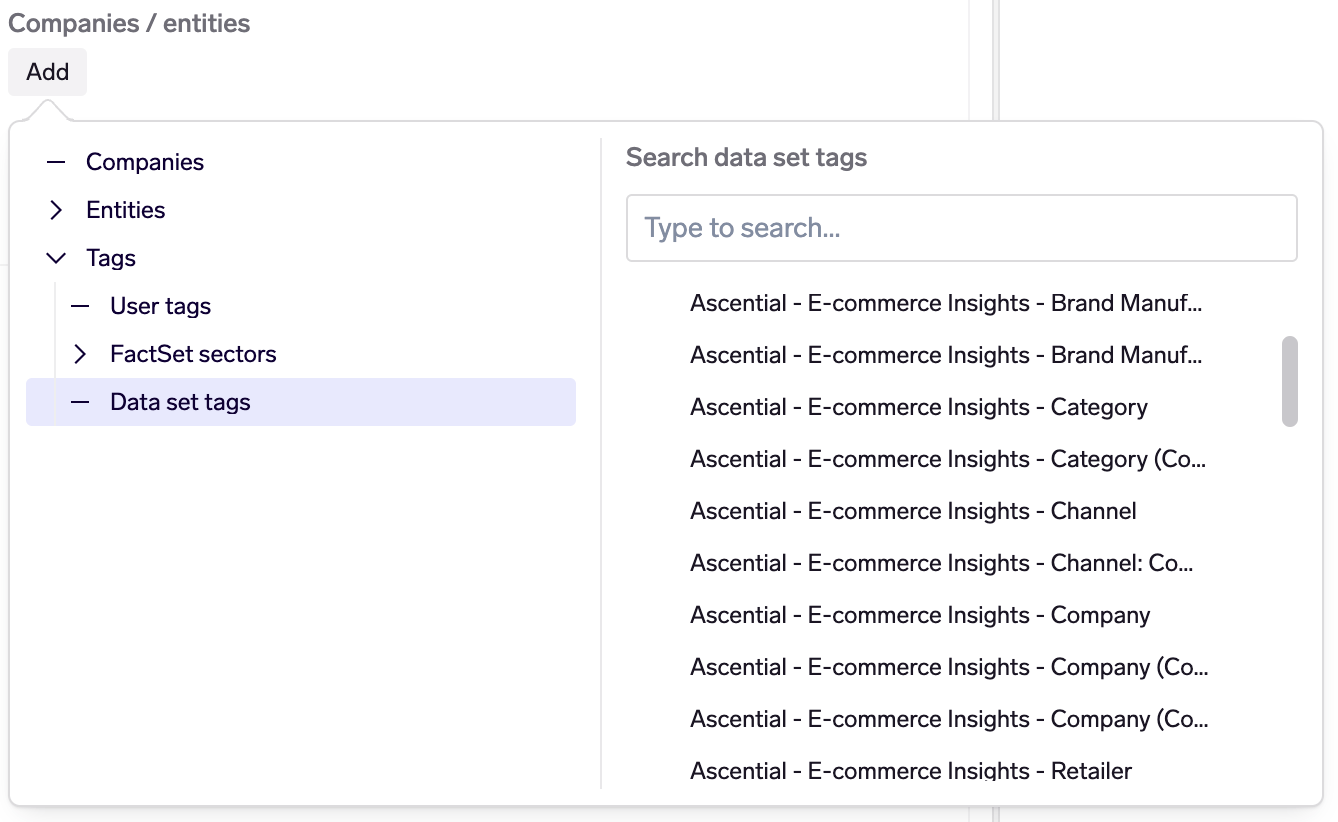
Data set tags are automatically maintained as entities are created, updated or deleted. Effectively, they mirror what you would see in Data Explorer if you selected a data set and viewed the table of entities of a given type.
Other new features
- Prediction models: Added "Ratio Prediction" as a new modelling technique. This was newly introduced as part of the KPI Analyzer (above), and incorporated into the existing Prediction model feature. For more information, please see the reference documentation.
- DSL: Allow specifying a list of line items in Visible Alpha signals. For each evaluation company, the line items will be tried in turn until a line item with data is found or the list is exchausted. This is useful for creating a single signal that represents a user's own "standardized" KPI, by specifying a list of company-specific Visible Alpha line items. See the DSL documentation for further information.
- DSL:
upsample()now has a new "auto" default for thefrom_freqparameter, which will try to automatically detect the frequency. This makes it easier for users to upsample their data before downsampling to a desired frequency. Note: this is a backwards-compatible change as this parameter was previously a required parameter; existing signals that specifyfrom_freqwill work as before. See the DSL documentation for further information.
Enhancements
- KPI Analyzer: Support KPI mappings configured with quarterly frequency, for companies that report semi-annually.
- KPI Mapper: Removed the "Disable relative change" option; for KPI mappings where absolute change is preferred (which is usually when the target KPI is already a ratio / percentage), turn on the "Model as a ratio" option instead.
- Dashboards: Downloading a dashboard with an active filter now includes individually selected companies in addition to tags.
- Dashboards: Allow extending the look-back time range of tables, from the default of 12 months (useful for dashboards with annual data).
- Charts: The panes for edit, chart and tables are now adjustable.
- Charts: All charts can now be configured to show labels on data points.
- Charts: Allow controlling chart legend position.
- Charts: Include chart name as the title when copying or downloading a chart.
- Charts: New y-axis configuration options (title, height, top, etc), which allow for charts with stacked y-axes.
- Data Explorer: Updated UI design to improve usability.
- Data Explorer: Selection of entities / signals is now persisted while switching between graph/table/split views.
- Prediction models: Added alpha, L1 ratio, and positive as model parameters for SARIMAX models.
- DSL: New
upsample_dailyparameter in theresample(),agg_change(), andagg_relative_change()functions. This makes it more convenience to upsample data to daily frequency, before downsampling to a desired frequency (egFQfor fiscal quarters). In general, Exabel recommends upsampling weekly/monthly data to daily first, before downsampling to fiscal periods, so as to better handle data periods that straddle 2 fiscal periods. See the DSL documentation for details. - DSL: Changed
publication_date()to use dates from the FactSet Fundamentals data for historical periods in , and dates from the FactSet Estimates data for future dates only. This alignspublication_date()withcompany_calendar(alignment='pd'). - Portfolio strategies: It is now possible to use data set tags when building a portfolio strategy.
- Screener: It is now possible to use data set tags when building a screen.
Bug fixes
- Dashboards: Fixed an issue where selecting multiple tags and then downloading a table would only include the companies that were included in all the selected tags instead of just any of the selected tags.
- Dashboards: Fixed an issue where charts linked to a main table would not update correctly when switching the table from multiple to single selection.
- Prediction models: Fixed an issue that led to the complete list of model runs loading immediately instead of partially loading when scrolling down.
- Signal editing: Fixed an issue with Chrome on Windows where the signal transforms menu was not displayed.
- DSL: Fixed an issue in
va_actual()were the evaluation would fail if the first year of the sub-annual calendar for a company is a year in which the company transitions from one annual calendar rule to another. - DSL: Fixed an issue where the
forecast('theta')transformation would fail if the frequency of the time series could not be detected. - DSL: Fixed split adjustment in the
trading_volume()signal. - Import jobs: Fixed an issue where numerical entity identifiers (e.g. if importing an entity with a resource name of
123) would fail be recognised. - Screener: Fixed an issue where editing a screen would fail to run or save.
- Screener: Fixed an issue that led to the complete list of companies in a screen loading immediately instead of partially loading when scrolling down.
- Portfolio strategies: Fixed an issue when searching for a company using some special characters would crash the UI.
- Alpha tests: Fixed an issue that led to the entire list of runs loading immediately instead of partially loading when scrolling down.
- Analytics API: Fixed an issue where the
RunPredictionModelAPI (inPredictionModelService) would run as the user that originally had created the model and not as the service account, as was already stated in the API documentation.