Revamped KPI Screener
We have released a revamped KPI Screener, which allows for you to screen / monitor your watchlist of companies for potential results beats / misses, based on your alternative data subscriptions.
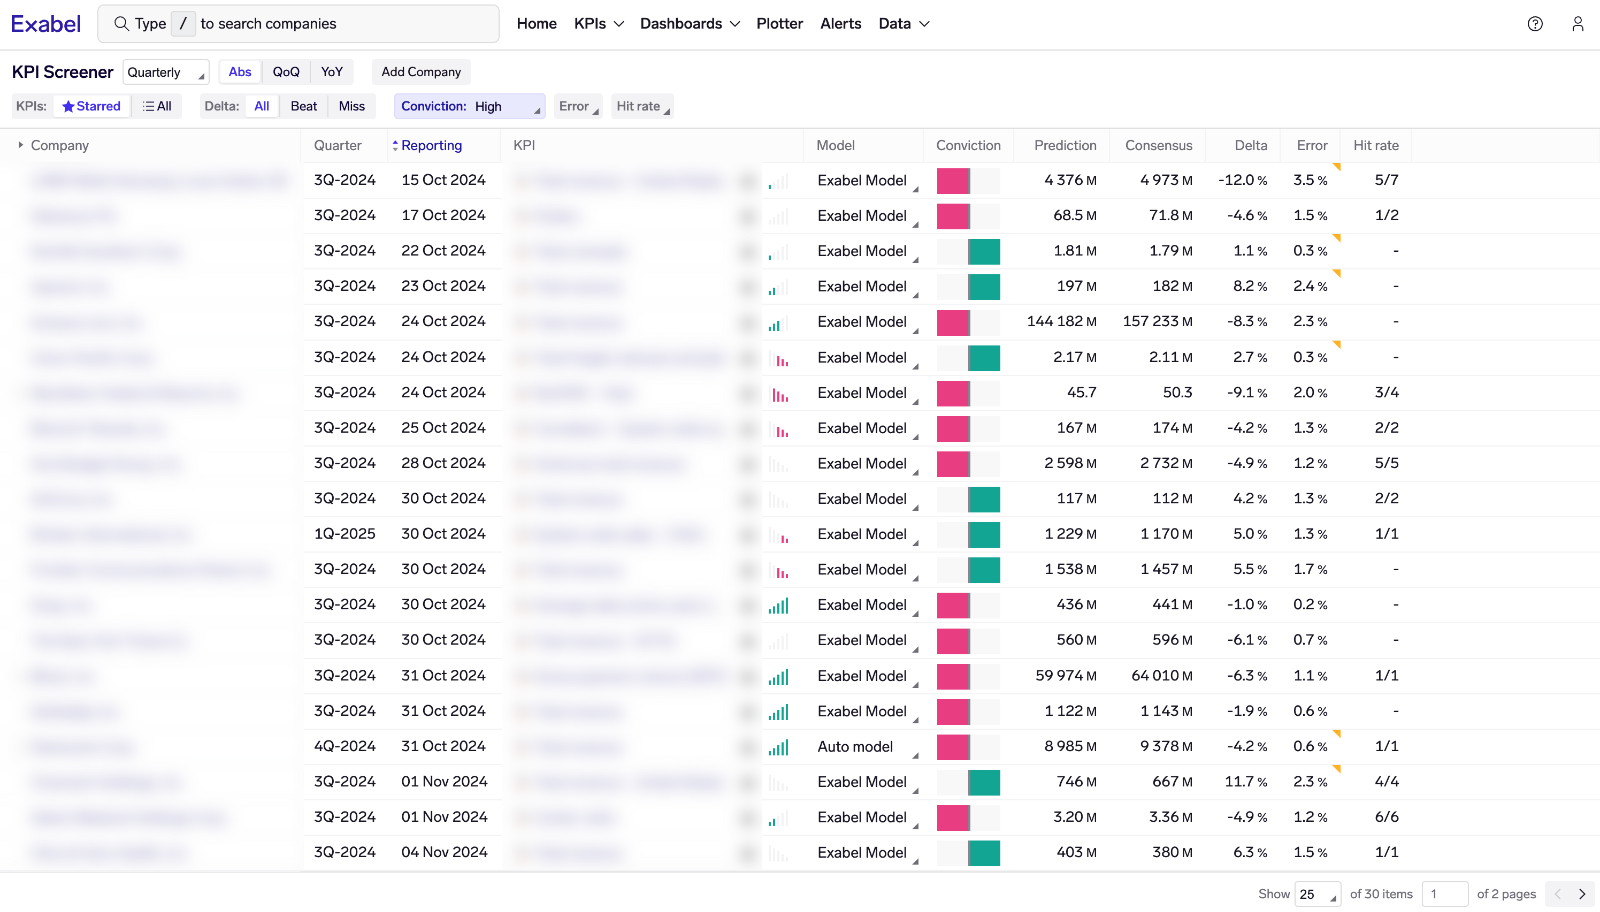
You can find the screener on the landing page when you login to Exabel, or under the KPIs menu.
The new Screener view has been simplified to consist of only the screener table. A new filtering user interface makes shows you the available filtering options, and makes it simpler to filter for beat/miss, models with low error, high hit rate, etc. By default, a conviction filter is applied to show only results with at least medium conviction (delta/error > 1.5). Any filtering / sorting you apply is also saved when you come back, and also reflects on the landing page widget.
When you find a result of interest, you may deep-dive into the company and the underlying vendor data by clicking on the company or KPI. This opens the KPI Analyzer, which is the single-company deep-dive view.
Finally, a new KPI impact indicator, displayed next to the star icon, shows correlation between KPI surprise (beat/miss) and the 1-day share price reaction post-results. This is calculated on all historical quarters, and shown with a graphical indicator highlighting the strength of correlation, and whether there is a positive or negative correlation. A tooltip shows the calculated correlation when you mouse-over the indicator.
Other changes
KPI Analyzer
KPI Analyzer now refers to the single-company deep-dive view, accessible by clicking on a company/KPI in the KPI Screener, or by searching for a company and switching to the KPI Analyzer view.
- Improved tooltips on the table and columns to better describe what is displayed. Also added tooltips to explain the hit rate numbers shown.
- Tweaked column widths to work better on smaller screens.
- Switched to split tooltips on charts to better view all data points for the same date.
- Revisions charts will show QoQ/YoY values as well when toggling in the table.
- Corrected date range on revisions charts, which previously cut-off relevant data when viewing revisions for historical quarters.
- Added a thicker line at y=0 on various charts to better distinguish between positive / negative growth.
- Removed model sharing shortcut to save space; this is less needed now as all users now see an Exabel model using their vendor subscriptions.
- Fixed an edge case where the point-in-time est. error was not displayed even when available.
Landing page
- Landing page: Removed the alerts widget, which was underutilized, instead giving more space to the KPI Screener widget.
- Landing page: It is now possible to click a watchlist item to view or edit it.
Overall app
- Companies / watchlists: Re-organized the company/watchlist picker to make watchlists easier to find. (This picker is shown whenever a user is asked to choose companies/watchlists.)
- Company pages: The primary RBICS L2 sector of the company is now displayed in the header.
- Design: Improved handling of long company names (now truncate company name, while always preserving the ticker).
- Design: Improved styling of table checkboxes & radio buttons, and the row-expansion button (in tables where rows can be expanded to show sub-rows).
- Menu: Removed old watchlist menu items from the Data menu.
- Import Jobs: Simplified uploading of global signals.