September 2024 update
Over the summer, we've introduced Exabel models, a new feature offering KPI predictions out-of-the-box, based on curated mappings from your vendor subscriptions. Users also benefit from a redesigned watchlist editor, navigation updates, and enhanced functionality in KPI Analyzer and Plotter (previously Signal Explorer). Various improvements and bug fixes are included.
New features
Exabel models
Exabel models are KPI prediction models that are automatically trained and run using the KPI mappings from Exabel's vendor integrations, based on your unique set of subscriptions. This gives new users instant access to model results, without having to first manually run and share models.
We have now run these on Exabel's core coverage universe of 700+ companies for all customers and partners. If there are other companies of interest to you, simply navigate to each company's KPI Analyzer page, and Exabel models will be run automatically on the existing vendor KPI mappings.
To see Exabel model results, simply open the KPI screener view, or navigate to the KPI Analyzer page for a company:
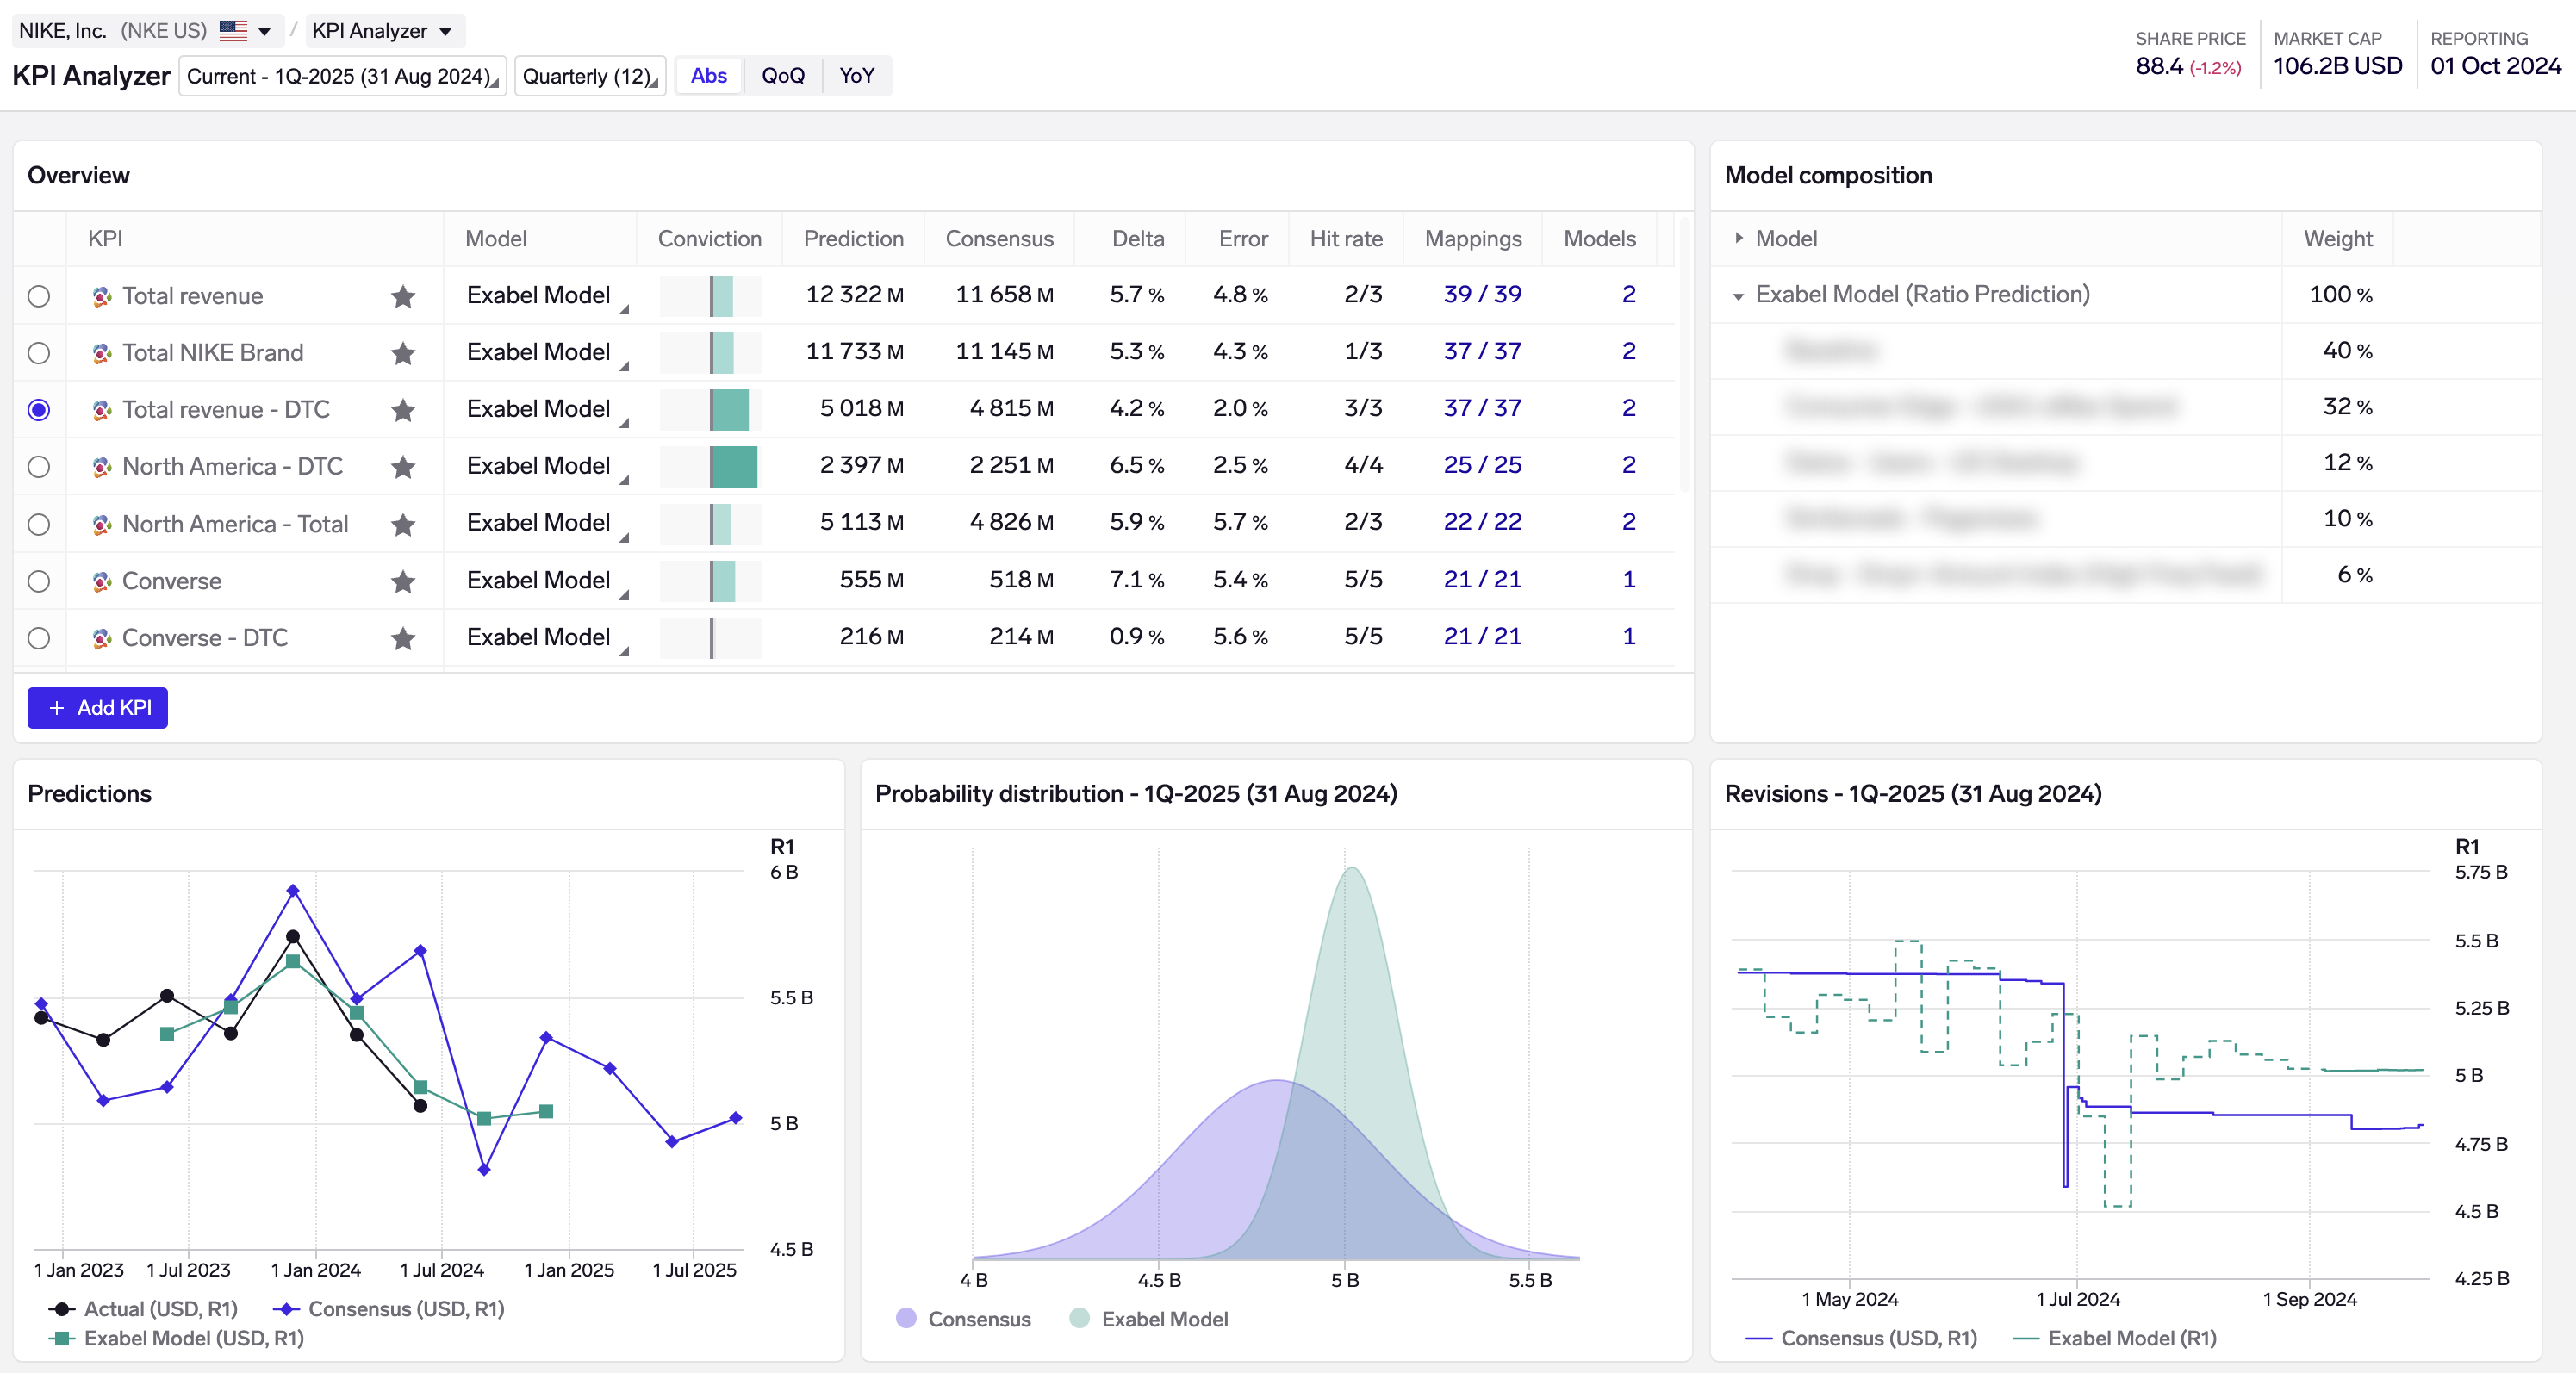
Exabel models in the KPI Analyzer
Similar to existing KPI models, Exabel models benefit from same rigorous point-in-time backtesting and error estimation, daily updated predictions based on the latest alternative data, and revision tracking.
Note that Exabel models use only Exabel's curated KPI mappings and not any custom KPI mappings that you create - to utilize these, you will still have to run your own custom models.
As part of this change, we are deprecating the concept of "Auto models", which were personal models accessible only to your own user. Existing Auto models that you may have previously run are still preserved, and may be deleted at your convenience through the Models view, but new Auto models will no longer be run as they have been replaced by Exabel models.
Watchlist editor re-design
Watchlists (previously called tags) have got a full makeover, and are now available on the landing page. Simply click on an existing watchlist to view/edit it, or click on "Create watchlist" to create a new one.
Adding companies to a watchlist
The new "Upload file" option in the watchlist editor also makes it easy to upload a list of tickers in a new watchlist, or append to an existing watchlist.
Navigation / menu updates
We have renamed "Signal Explorer" as "Plotter" to better reflect its role as a data exploration & chart creation tool.
The top menubar in the app has also been modified to bring Plotter and Alerts into the top-level menu, reserving the Data menu strictly for data exploration and management pages.
KPI wizard in Plotter
In Plotter, FactSet and Visible Alpha KPIs can now be searched and added, with a range of options to plot actuals, consensus or revisions.
When clicking Add under Signals, FactSet and Visible Alpha now appear as 2 new tabs next to the Library. Upon selecting a KPI, simply choose and configure what you want to plot, and click Add:
Plotting Total revenue actuals, consensus, and revisions
Other
- KPI Analyzer: In the Mappings view, it is now possible to copy existing KPI mappings from the company's other KPIs. This is useful when adding new KPIs that vendor that has not been mapped to.
- KPI Mapper: Mappings now support last resampling method.
- KPI Mapper: It is now possible to open KPI mapping collections and view results from non-subscribed vendors who have consented to make their results accessible to buy-side users.
- Import Jobs: Data sources can now be reused across different import jobs.
- DSL: New
signal.cumprod()function to calculate a cumulative product, optionally over specified periods. This is useful when working for example with daily share price returns time series, and where you want to calculate monthly returns as a product of daily returns. (Reference)
Improvements
-
KPI Analyzer (single-company)
-
Colors in charts are now aligned such that the same model is always given the same color in every chart.
-
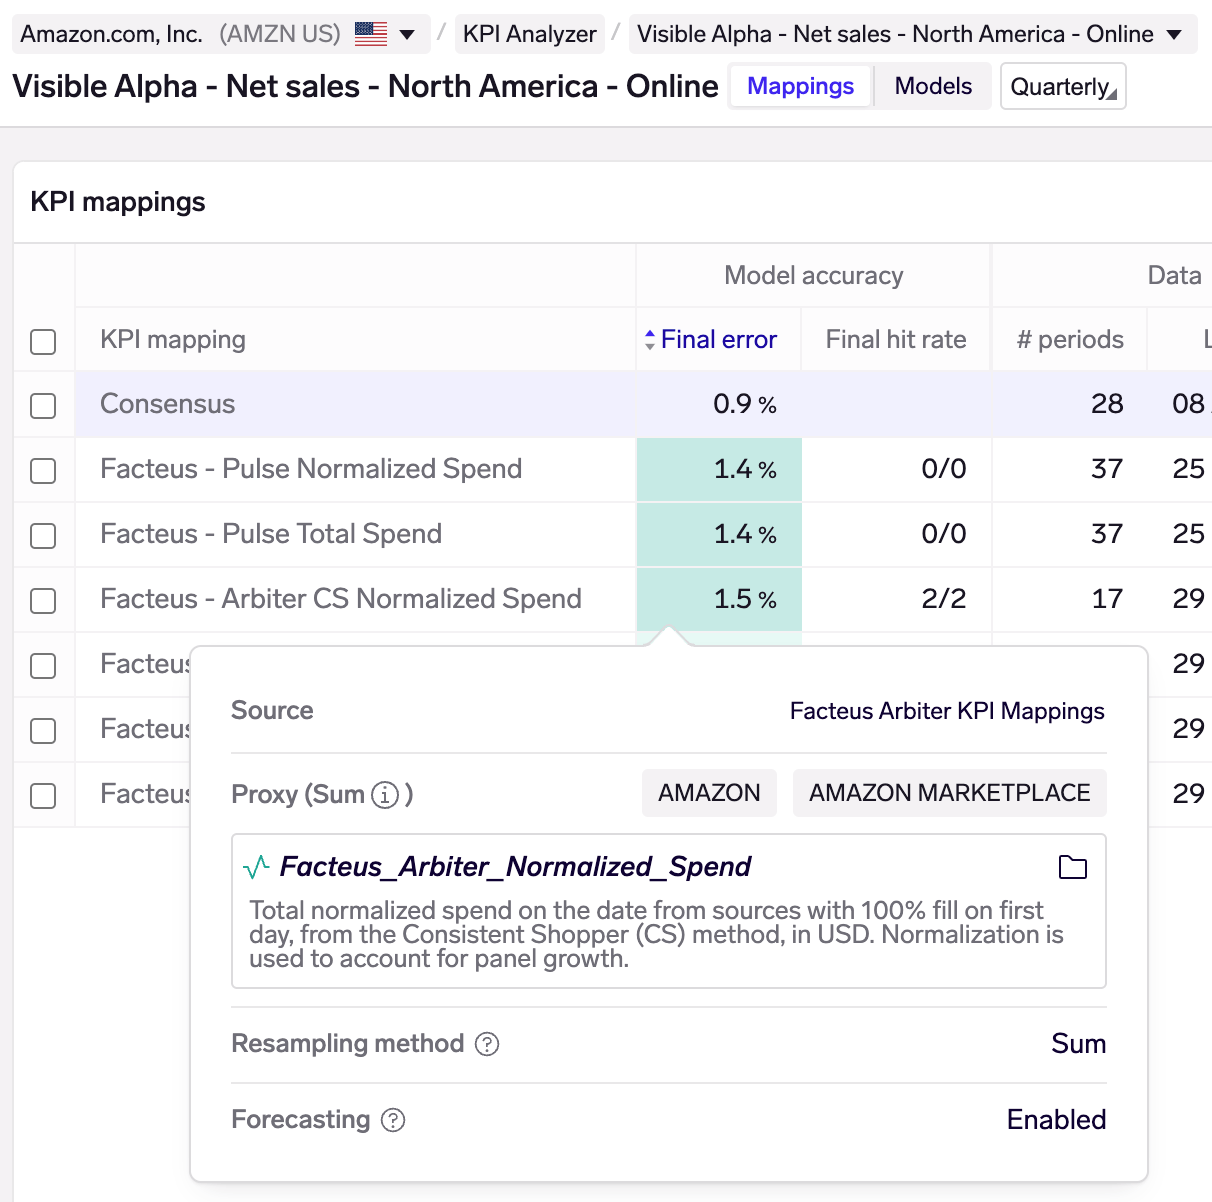
When clicking to view information on a KPI mapping, the proxy signal name and description is now shown, to better provide transparency on what data is being mapped to the KPI. The proxy signal expression can be shown by clicking on the signal name.
-
Tables have been adjusted for better support for smaller screen or window size.
-
When QoQ/HoH/YoY is selected, the Predictions chart now shows QoQ/HoH/YoY changes in the actual KPI, consensus, and model predictions.
-
In the revisions chart, the consensus revision line now extends to the current date, and the actual (reported) value is displayed for historical periods.
-
In the Mappings view, mappings are now sorted by default on backtest model error, putting the best mappings on top.
-
In the Models view, consensus is now auto-selected.
-
In the Monitoring view, non-subscribed mappings are no longer listed in the monitoring view, as they were not selectable and cluttered up the "KPI mappings" breakdown table.
-
-
KPI Analyzer (screener view)
- Removed the "Mappings" and "Models" columns in the multi-company KPI Analyzer, to streamline the feature for screening of KPI prediction results.
- Simplify interface by removing the report date filter, which was not used often.
-
KPI Mapper: It is now possible to exclude companies from bulk mapping. This is used by Exabel when curating vendor KPI mappings - where we see data issues with some companies that mean their modelling results are not usable, we now exclude them from the bulk mappings.
-
KPI search: Visible Alpha line items can now be searched by line item number. (The KPI search appears when choosing to add a new KPI in KPI Analyzer, or in the new Plotter KPI wizard)
-
Alerts
- Updated design for the alert manager, showing the shared and vendor alerts in separate sections. Also updated design for the alert feed.
- Alerts: Added a sharing button next to each alert in the alert manager, allowing for easier sharing of alerts.
-
Overall: Only show the "What's New" pop-up to existing users who are logging in for a second or subsequent time.
-
Charts - Excel downloads
- Downloading chart data will always produce a single Excel file.
- Downloading chart data now respects quick transforms set in the chart.
- Company tickers are included in Excel downloads.
- Currency is included in Excel downloads.
-
Alerts
- The event modal for alerts has been redesigned.
- It is now possible to create alerts on global signals (signals not connected to any entities).
-
Import Jobs: Import jobs and stages are sorted by name.
-
Sharing: When sharing objects (e.g. models, charts, dashboards) in the Library or from the sharing modal, it is now possible to view the users of the groups that you are sharing with.
-
DSL:
signal.truncate()now supports abetweenparameter to truncate only data points between 2 dates. It is also possible to truncate between multiple date pairs. (Reference)- Renamed parameter
statistic_type_nametostatisticfor the FactSet Estimates functionsfs_consensus,fs_metric,fs_revisions, and the Visible Alpha functionsva_consensus,va_metric, andfs_revisions. - Added
statistictypeup(number of broker estimates revised upwards) anddown(number of broker estimates revised downwards) to the FactSet estimates functionsfs_consensusandfs_revisions. - Statistic types
maxandminare now supported for the FactSet Estimates functionsfs_consensus,fs_metric, andfs_revisions.
Bug fixes
- Charts - Excel downloads
- Fixed an issue where downloading chart data that contains data from a non-exportable signal (e.g. raw FactSet price or estimates) made the download fail. We now exclude the non-exportable data from the download.
- Fixed an issue where downloading chart data failed completely if any signal had a warning or error. The error or warning message is now included in the first data row in the Excel file instead.
- KPI Analyzer
- Fixed bug where KPI mappings on ratio KPIs (e.g. same-store sales) were shown with percentage rather than absolute backtest errors.
- Fix bug where models for ratio KPIs (e.g. same-store sales) failed to run because the models were incorrectly disallowing negative values.
- Fix edge case bug when specifying weights caused the user interface to incorrectly prevent running models.
- Fix issue where Reader users did not see results from shared KPI models.
- KPI Mapper: Fix issue where users were unable to create new KPI mapping collections if they did not have any existing collections.
- Watchlists: Fixed buggy scrolling when a large list of companies is uploaded.
- Import Jobs
- When navigating to an import jobs from the list of import jobs, the schedule field was not populated.
- When previewing a query with duplicate columns, the column headers were out of sync when removing the duplicate column.
- Fiscal calendar: fixed various edge case bugs with the calendar imputation and forecasting algorithm.
Deprecations
- DSL: Parameter
statistic_type_name(replaced withstatistic) for the FactSet Estimates functionsfs_consensus,fs_metric,fs_revisions, and the Visible Alpha functionsva_consensus,va_metric, andfs_revisions, will be removed after 2024-07-31. - DSL: Statistic types
highandlow(replaced withmaxandmin) for the FactSet Estimates functionsfs_consensus,fs_metric, andfs_revisionswill be removed after 2024-07-31.