December 2023 update
Happy New Year! We wrapped up 2023 with a slate of significant product releases. It is now possible to create new custom mappings & models directly in the KPI Analyzer, get more transparency on KPI results through additional KPI analysis widgets, and browse/manage KPI mappings more effectively in the KPI Mapper. Outside of KPI analysis, we've also added numerous enhancements and bug fixes to charts, dashboards, the signal DSL, and other features.
New features
Custom KPI models
Previously, we introduced Auto models in the KPI Analyzer, which automatically combine all KPI mappings you have available to train KPI prediction models. It is now possible to create custom models with your own choice of inputs (KPI mappings) and model type.
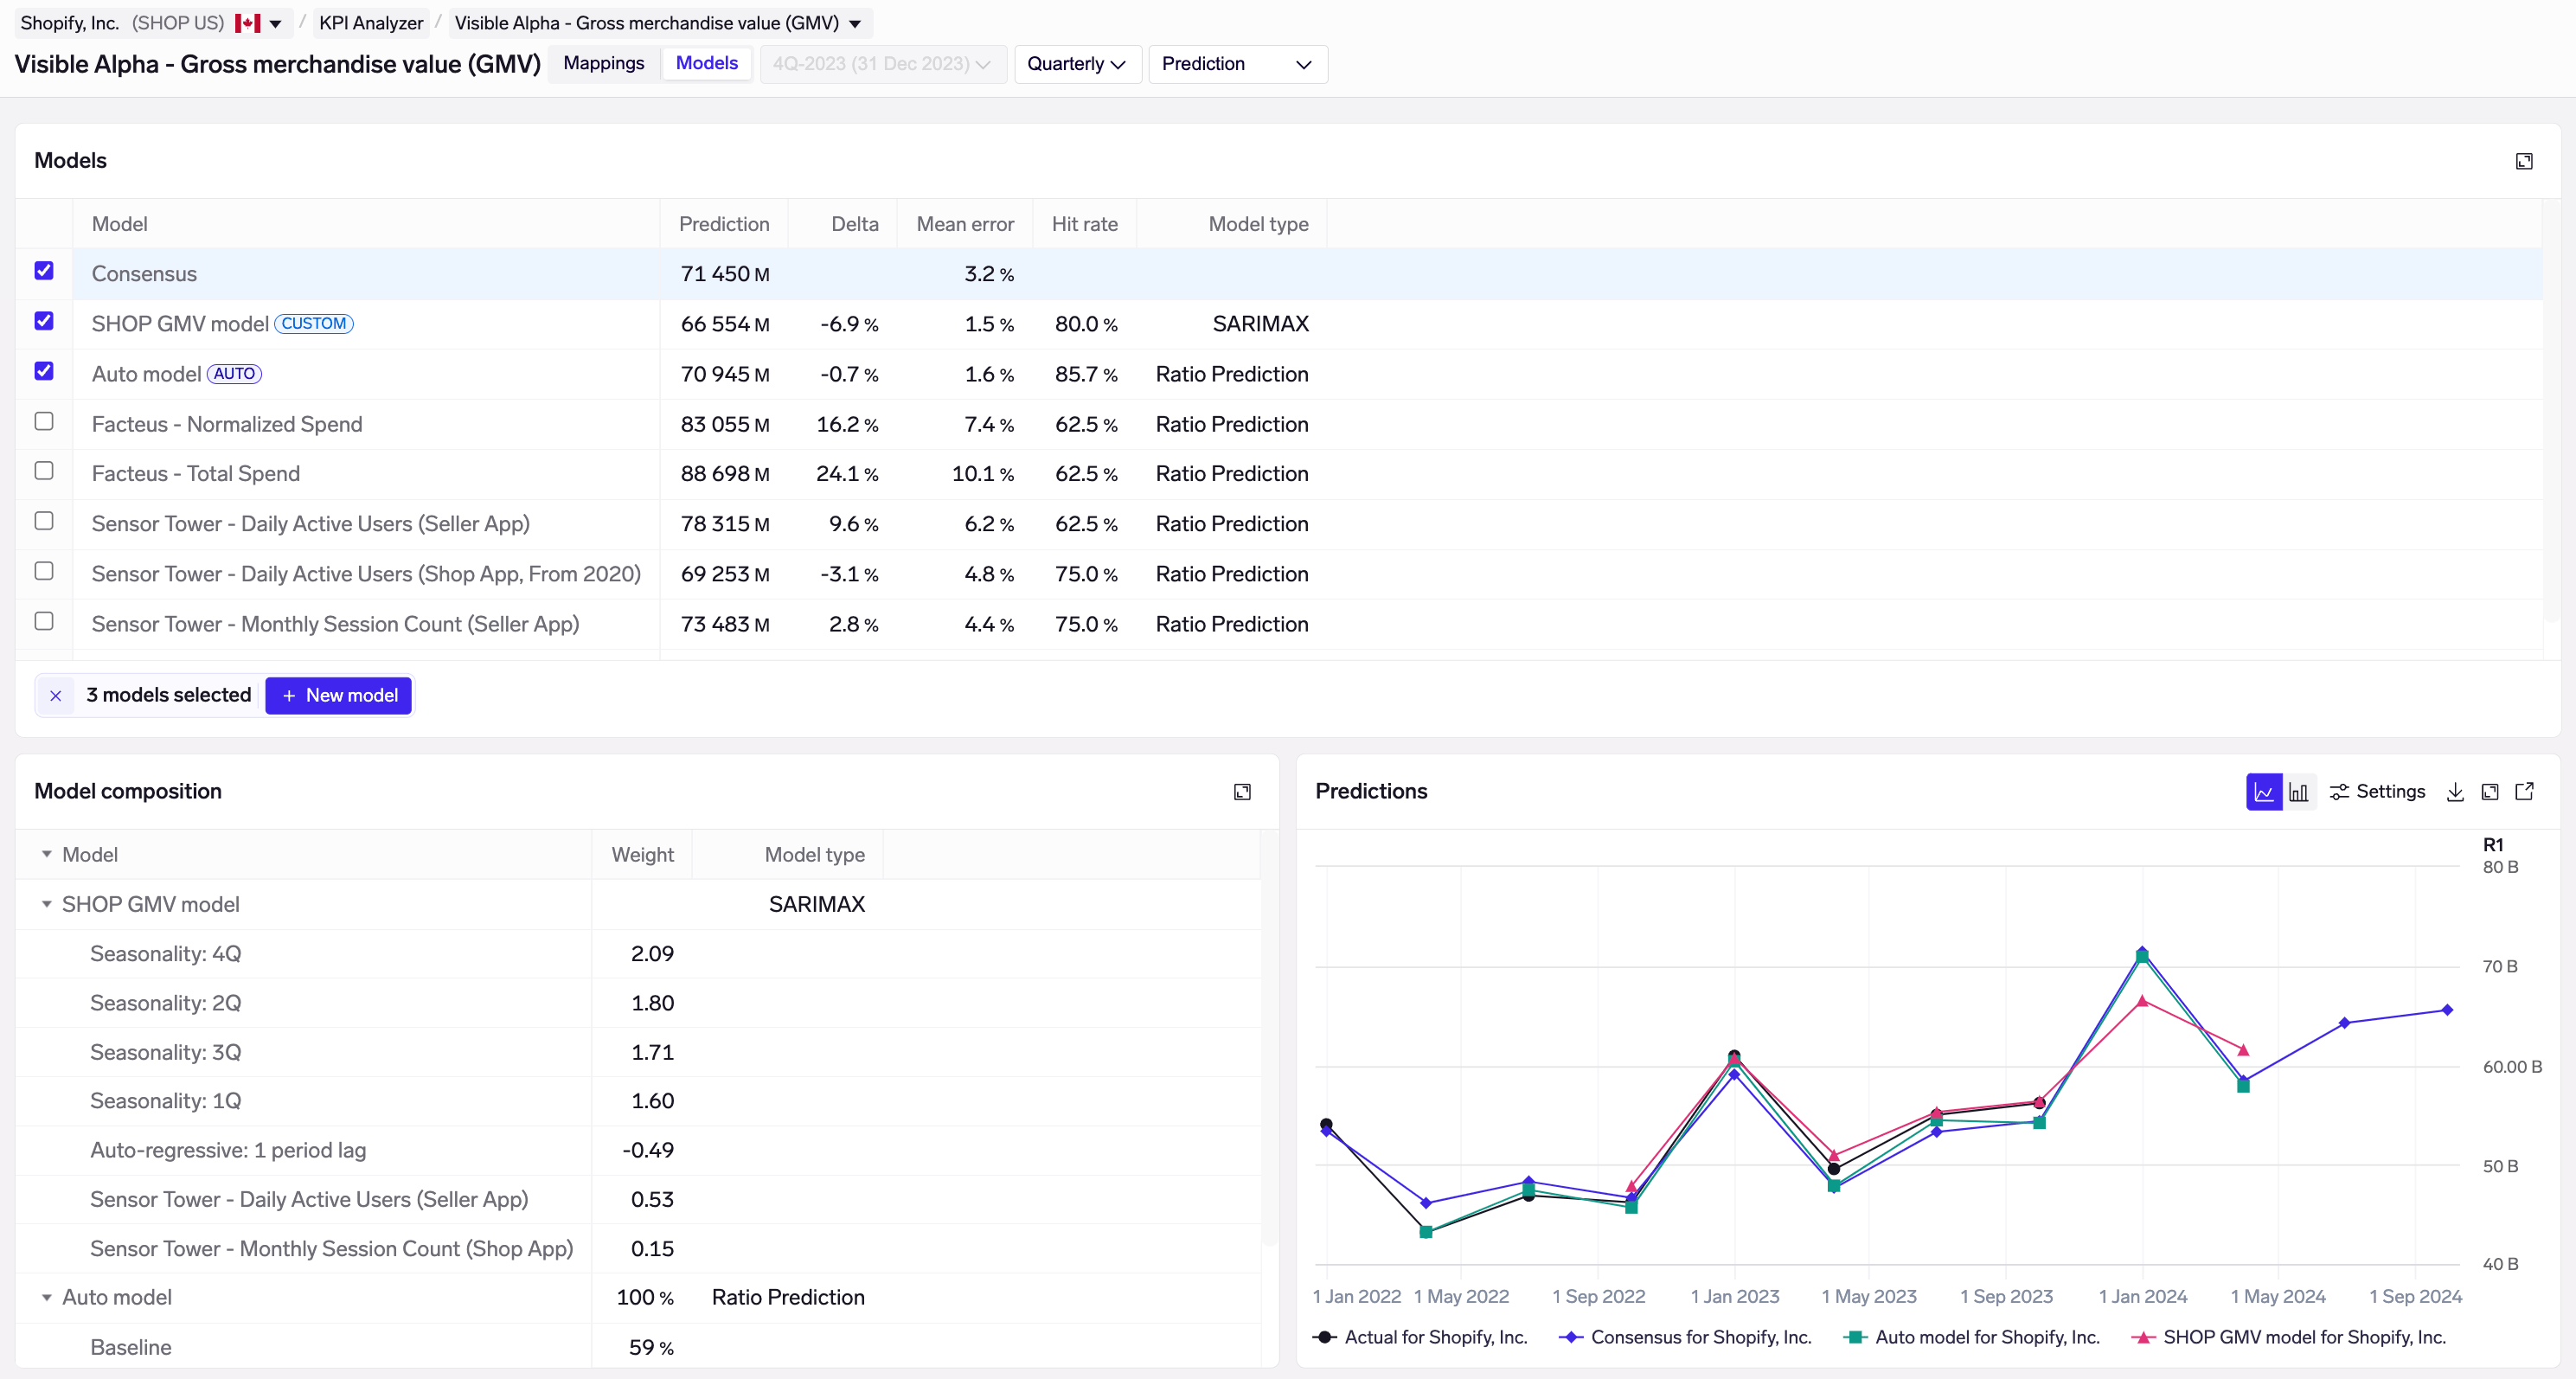
Custom and Auto models in the KPI Analyzer
New custom models can created by navigating to a specific company and KPI, then clicking on "Add model". Then select which KPI mappings you want to use, and a model type.
Model training and backtesting is blazing fast, averaging 1-2 seconds. This allows you to quickly test lots of new model configurations, and how new custom KPI mappings perform in a model. Once you're satisfied with your results, simply save the model to your Library. From there, it can be easily shared with your teammates.
Once saved, all KPI models (Auto & custom) have their results saved in the background so that they load instantly the next time. All models undergo re-training and inference daily, and a true point-in-time revision history of their predictions is saved.
New widgets for KPI analysis
We have added 6 new sets of widgets in the KPI Analyzer to provide greater detail and transparency:
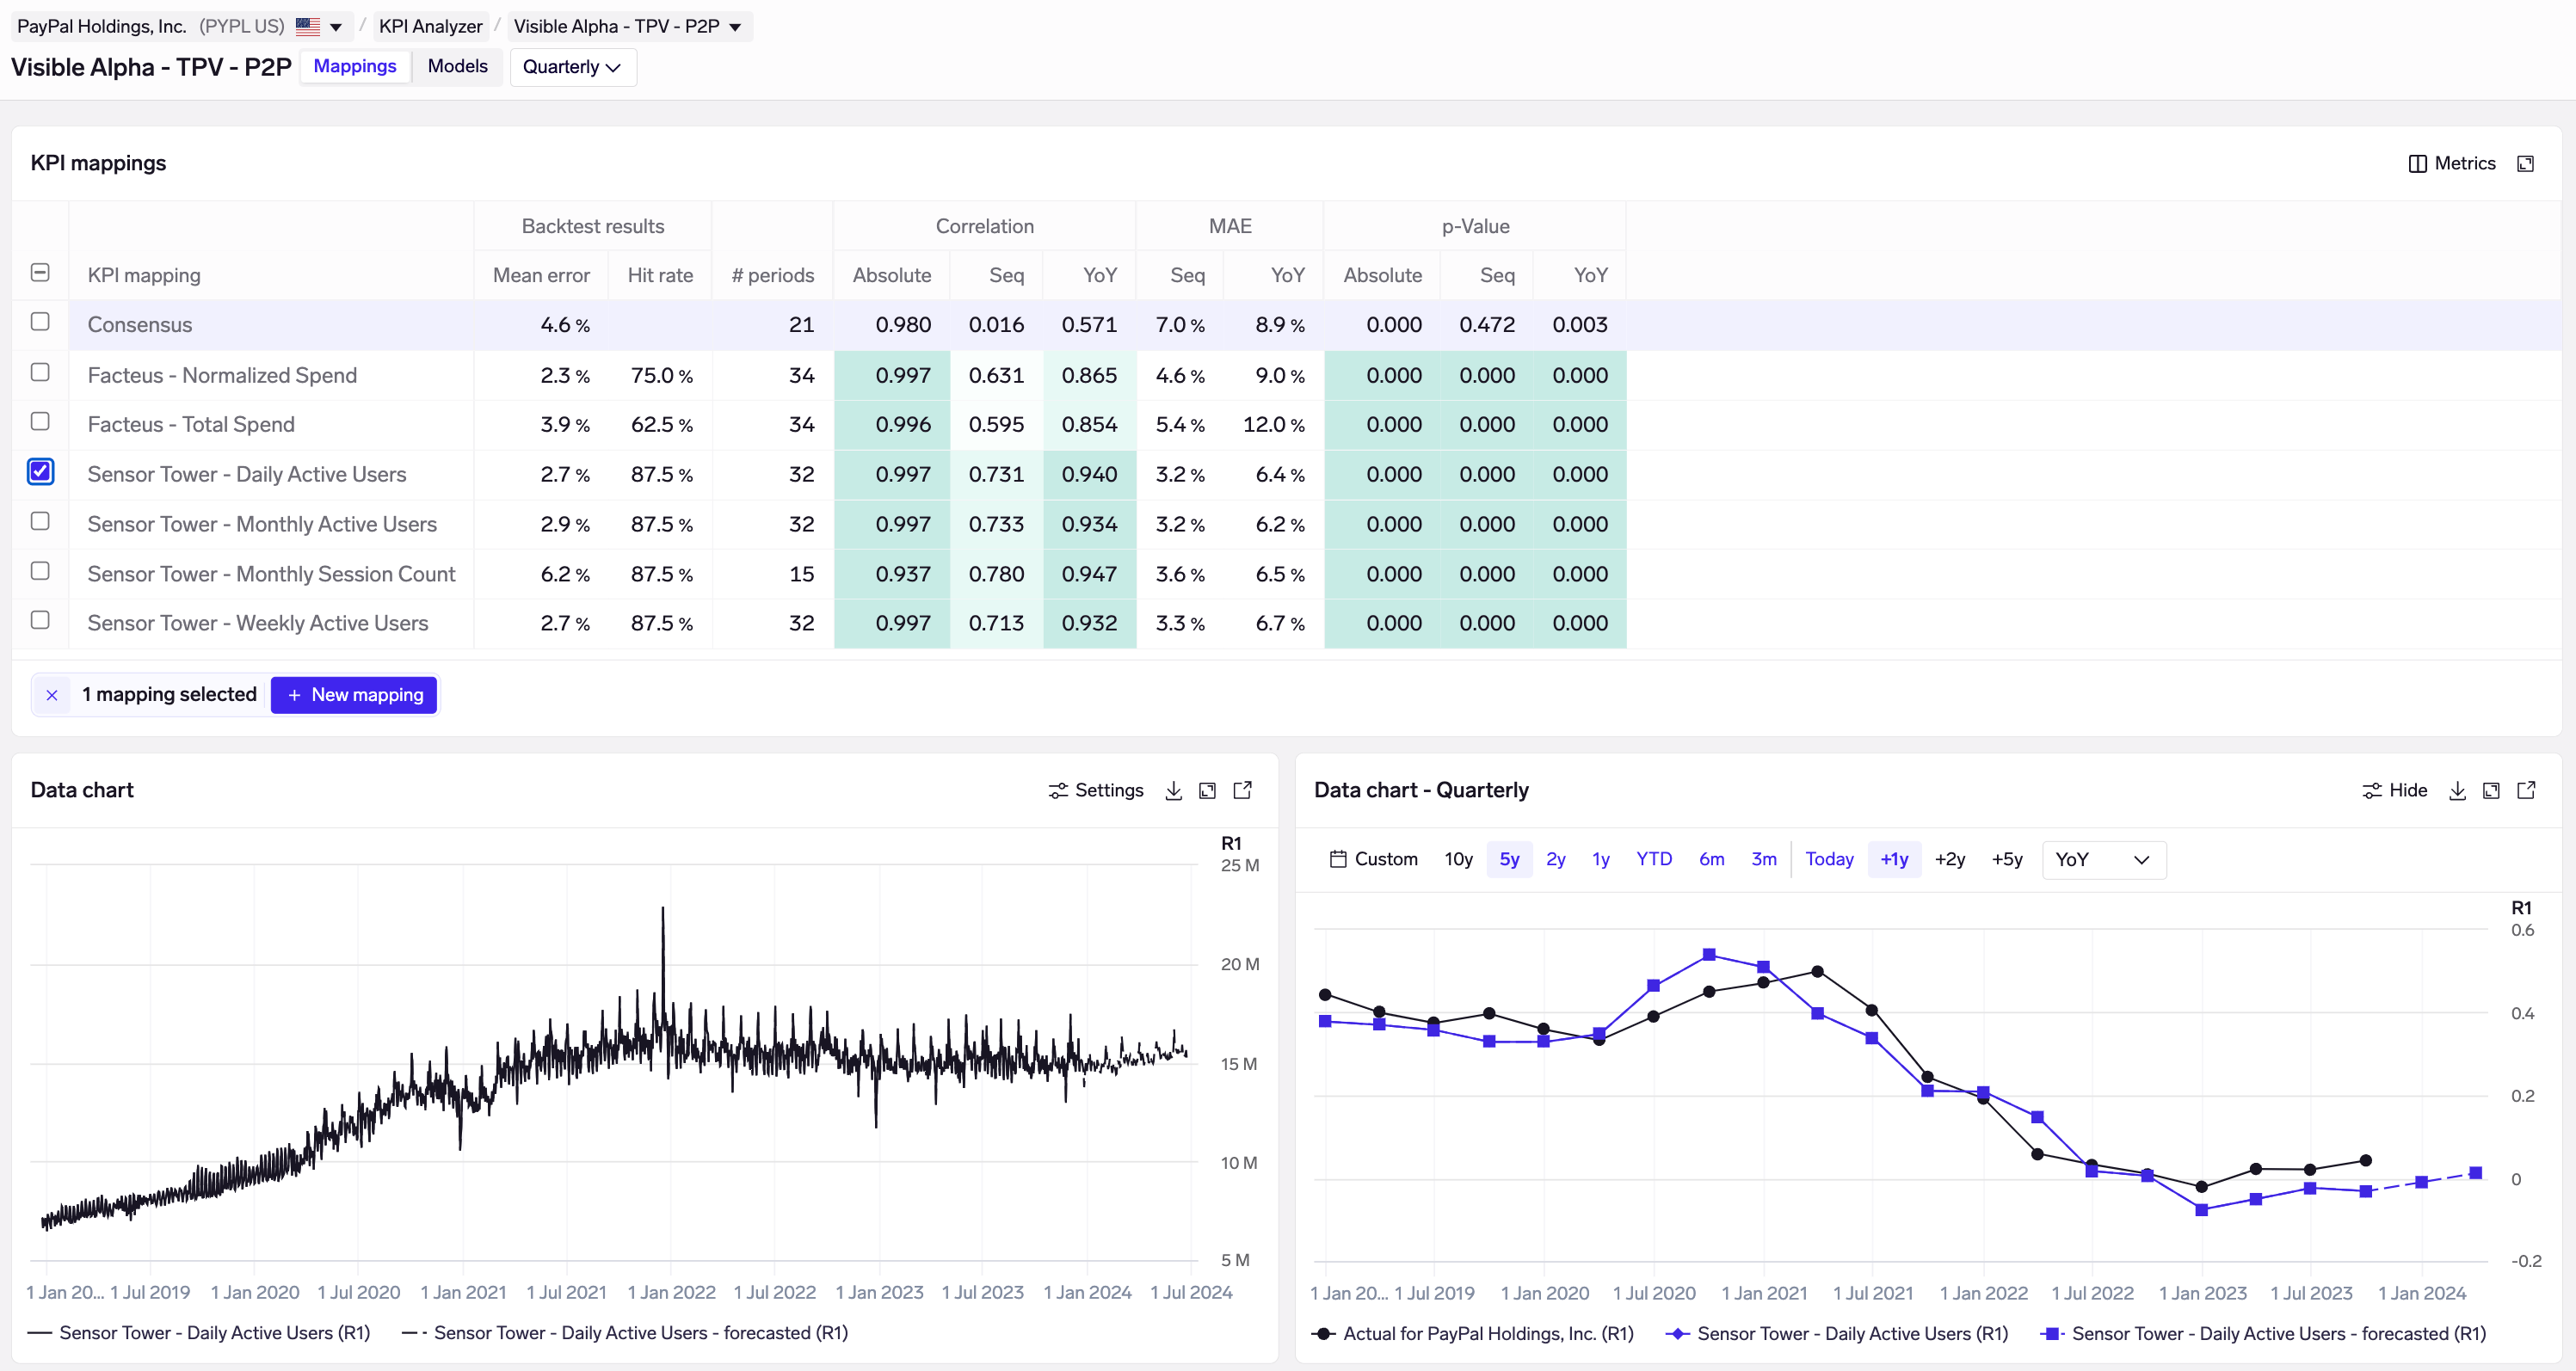
New Data charts in the KPI Analyzer's Mapping view
- New data charts in the Mapping view show the proxy signal for selected KPI mappings, both as the original proxy signal, as well as resampled to quarters.
New widgets in the KPI Analyzer's Models view. (Also available in the Monitoring view showing all KPIs for a company.)
New widgets in the Monitoring & Models views:
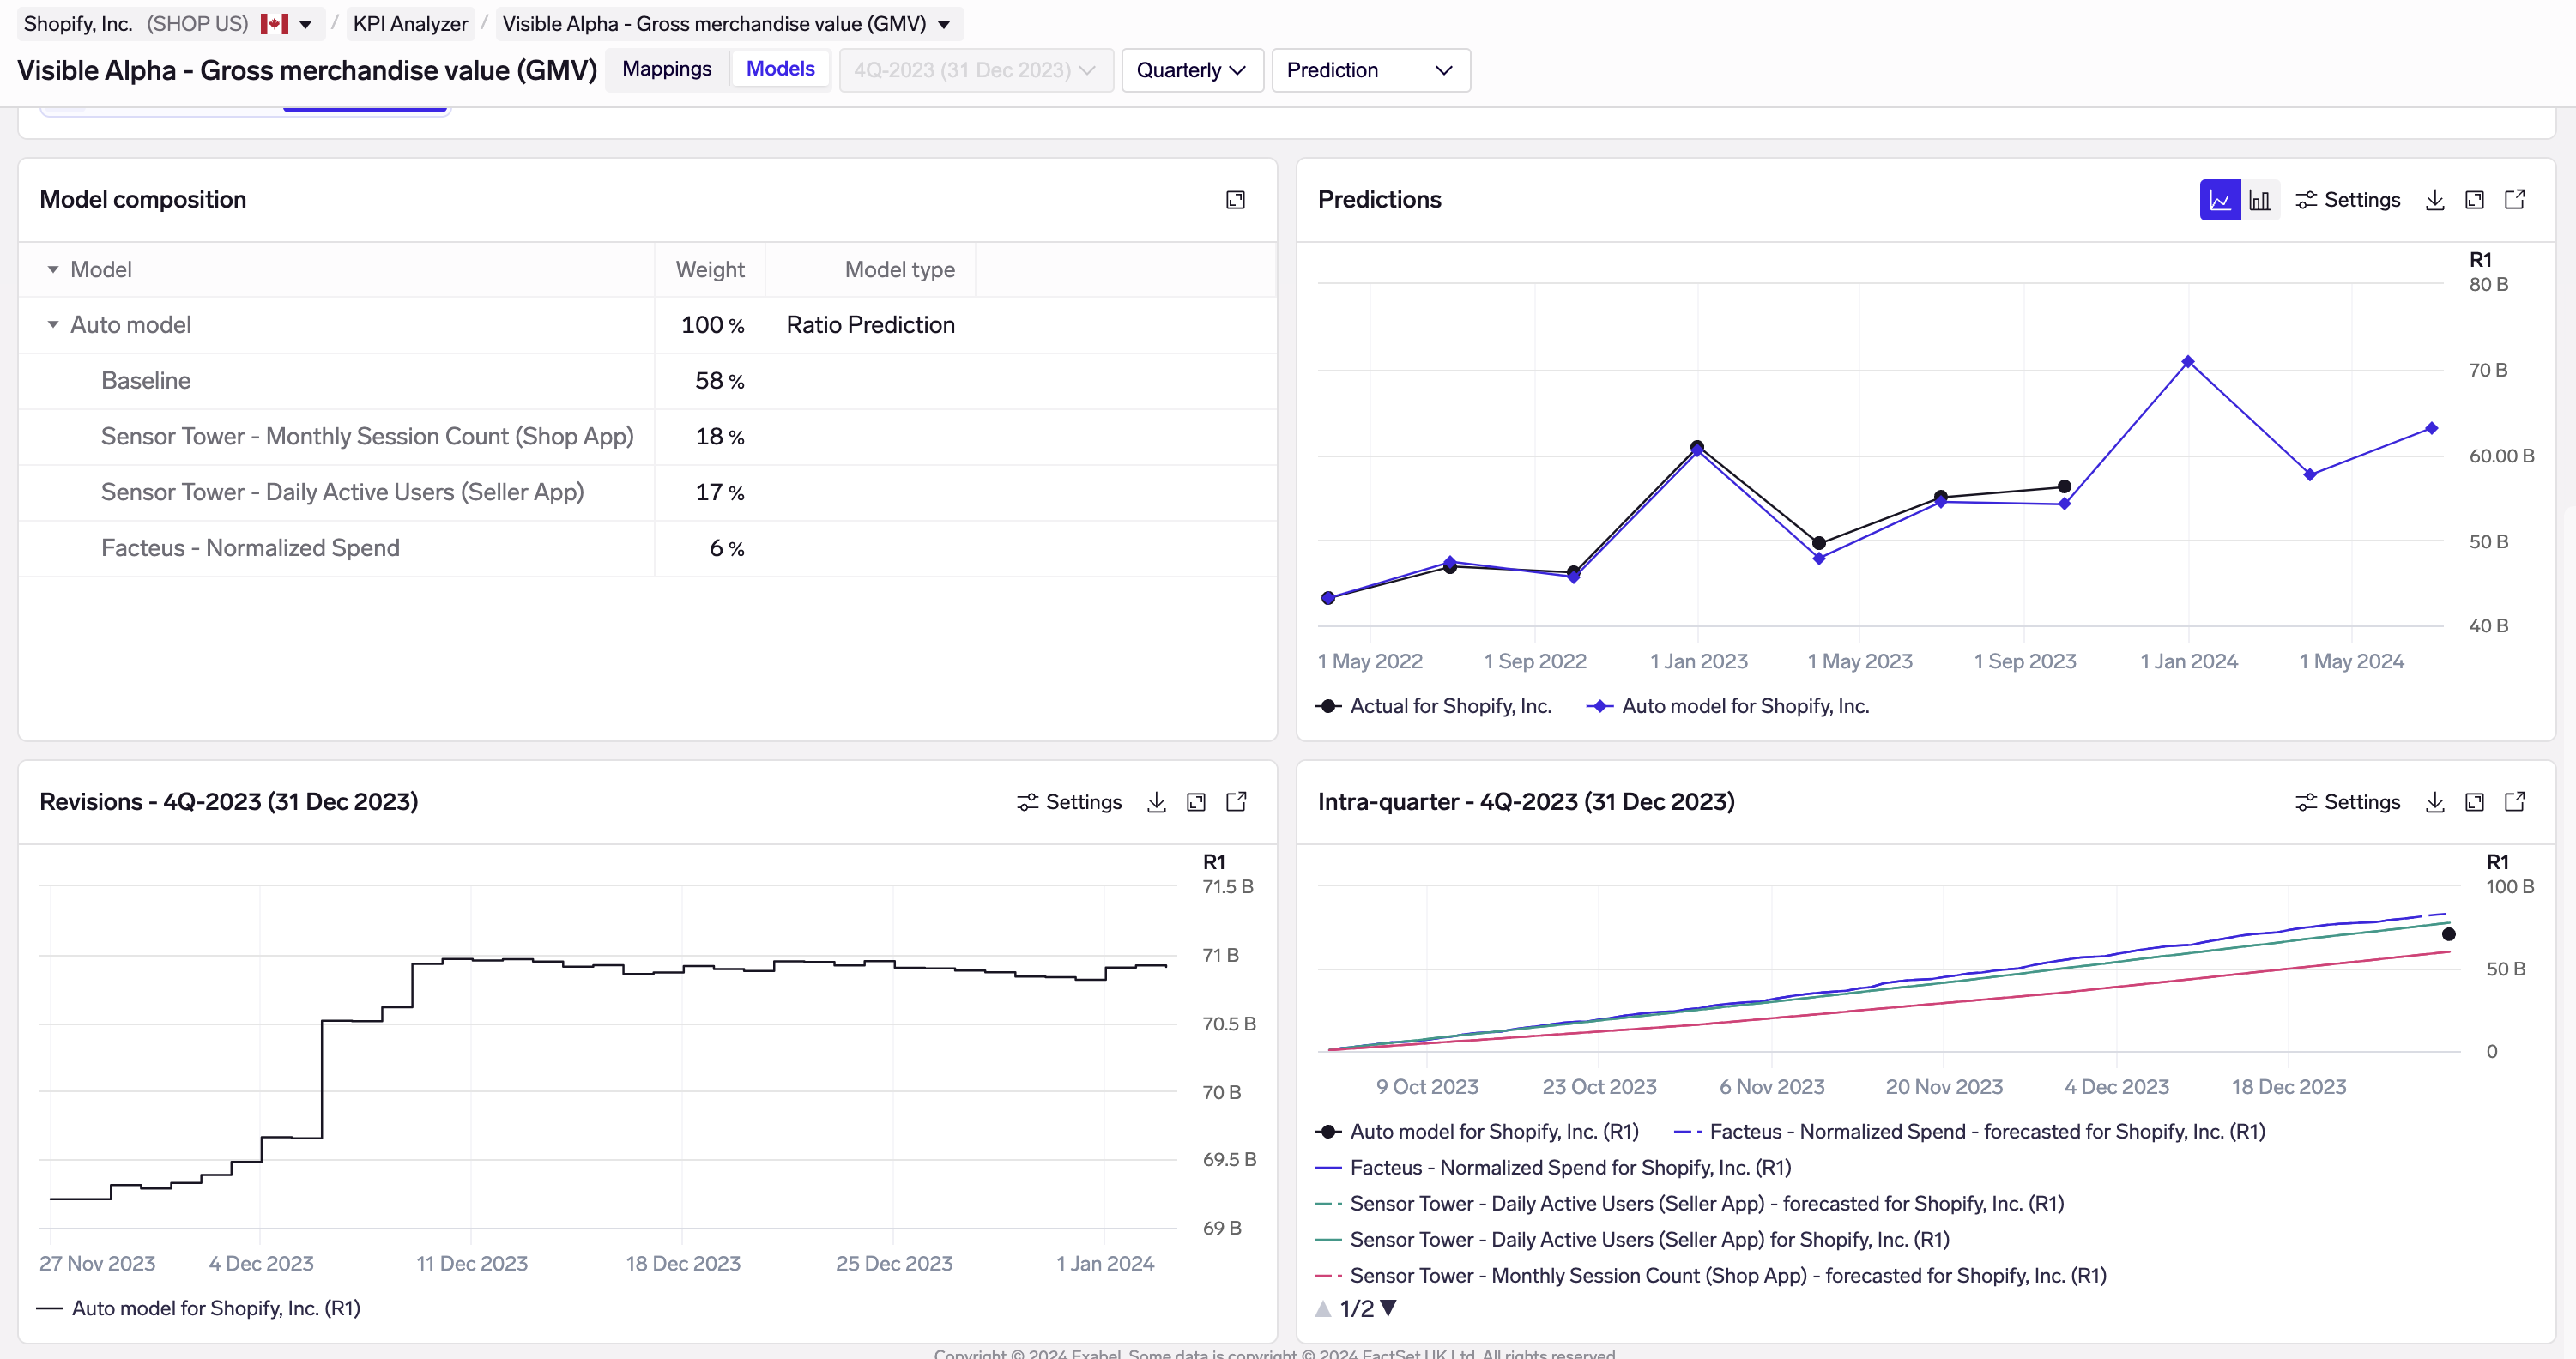
- Predictions chart showing quarterly model predictions, overlaid over actual & consensus.
- Prediction error chart showing backtested prediction errors for historical periods. This may be found by clicking on the column chart icon in the existing Predictions chart.
- Model composition widget showing the weights assigned to each predictor. This is shown for Auto models and custom models, which combine 1 or more KPI mappings.
- Model revisions chart showing how model predictions have changed over time as new data comes, overlaid with consensus revisions.
- Intraquarter tracker chart showing how the underlying data is trending during a quarter and building up to the KPI prediction.
Improved KPI mapping
As KPI mapping is an important step in the KPI analysis process, we've made it significantly easier to browse, create and edit KPI mappings.
For analysts that are focused on analyzing one or a few companies, we've made it possible to create new mappings directly in the KPI Analyzer, under the Mappings view. Simply click on "New mapping", to test a new mapping. Backtests and evaluation results (correlations etc) are calculated in seconds, allowing you to see if your new mapping could be a good predictor of the KPI. Once you're happy, you can save the new mapping to a KPI mapping collection, which helps you organize your mappings.
Testing a new KPI mapping directly in the KPI Analyzer
The KPI Mapper is where you go to browse and manage your KPI mapping collections. This includes vendor KPI mapping collections, which you can browse through as well. Here, we've added a new section for company-specific KPI mappings, where deep/custom mapping can be done on company-specific KPIs. This complements the existing section for bulk KPI mappings, which are standardized mappings to a common KPI (e.g. sales) across many companies at once.
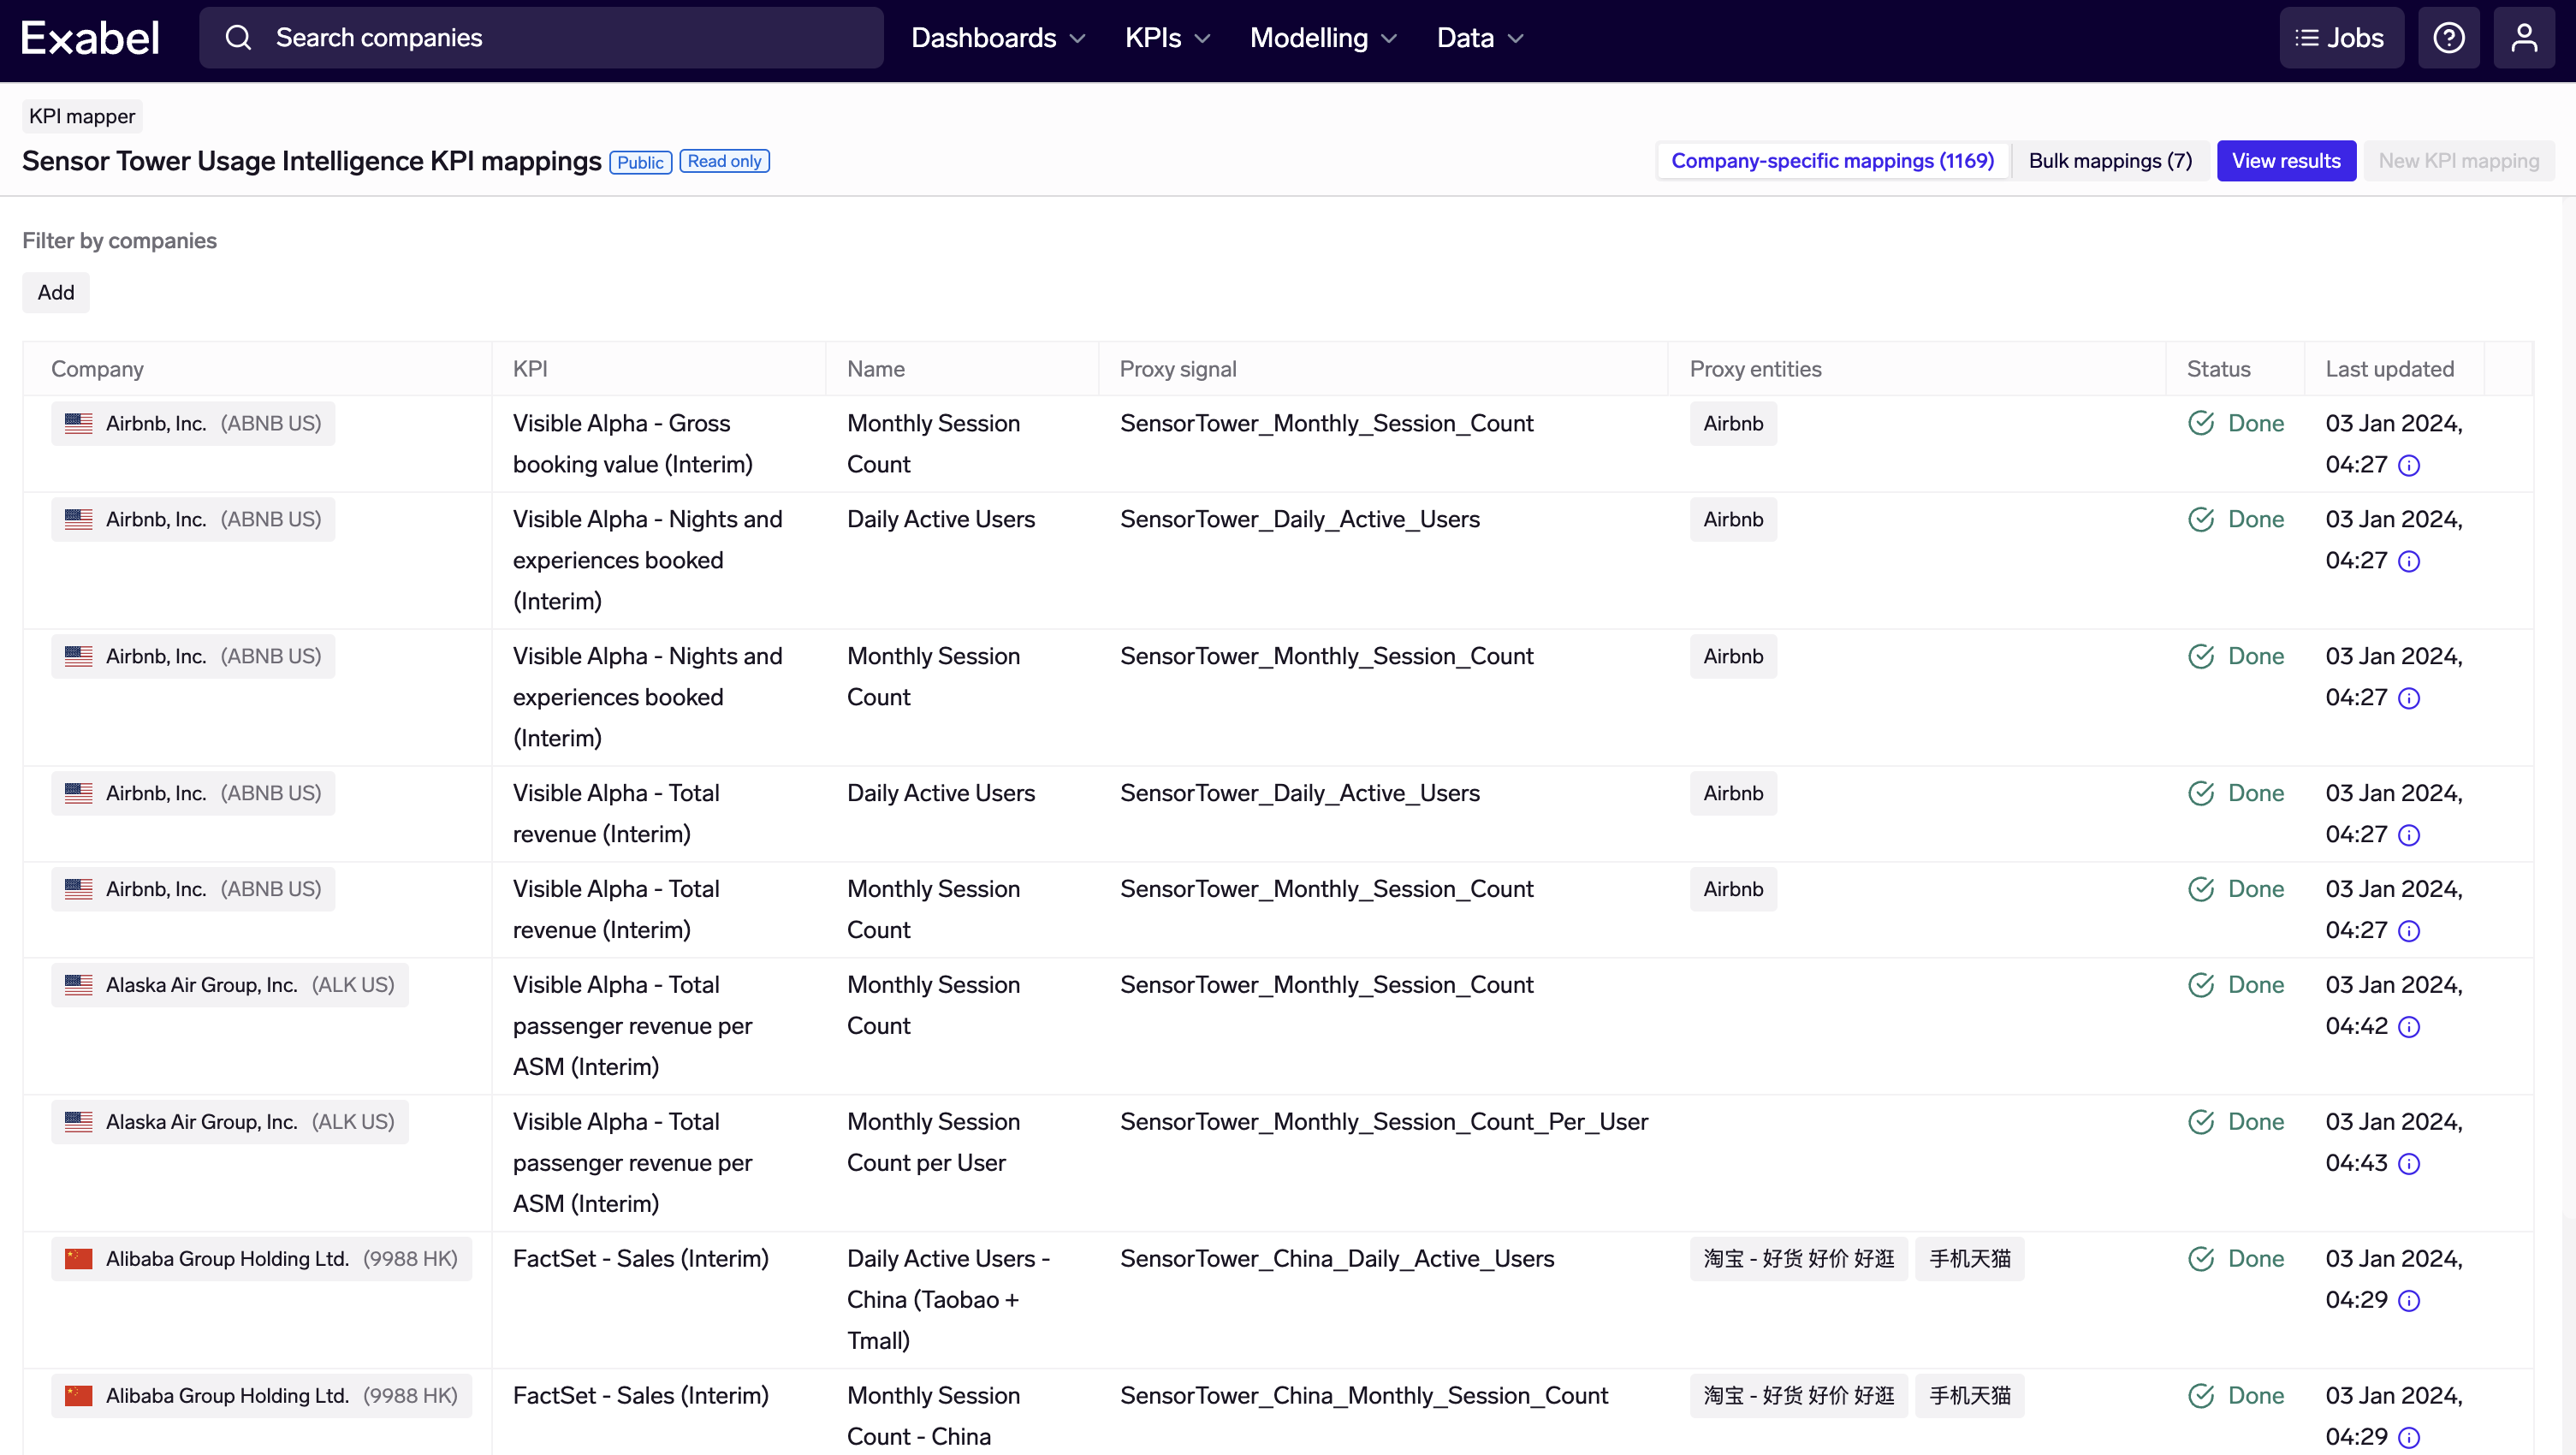
New section for browsing and searching for company-specific KPI mappings, in the KPI Mapper
In the KPI Mapper, it is also now possible to clone a company-specific KPI mapping, allowing for easier creation of multiple mappings for the same company / KPI.
Finally, in the KPI Mapper, we also added a results view which summarizes results across all companies in a KPI mapping collection. This allows for quick browsing across companies, without having to view each company individually in the KPI Analyzer.
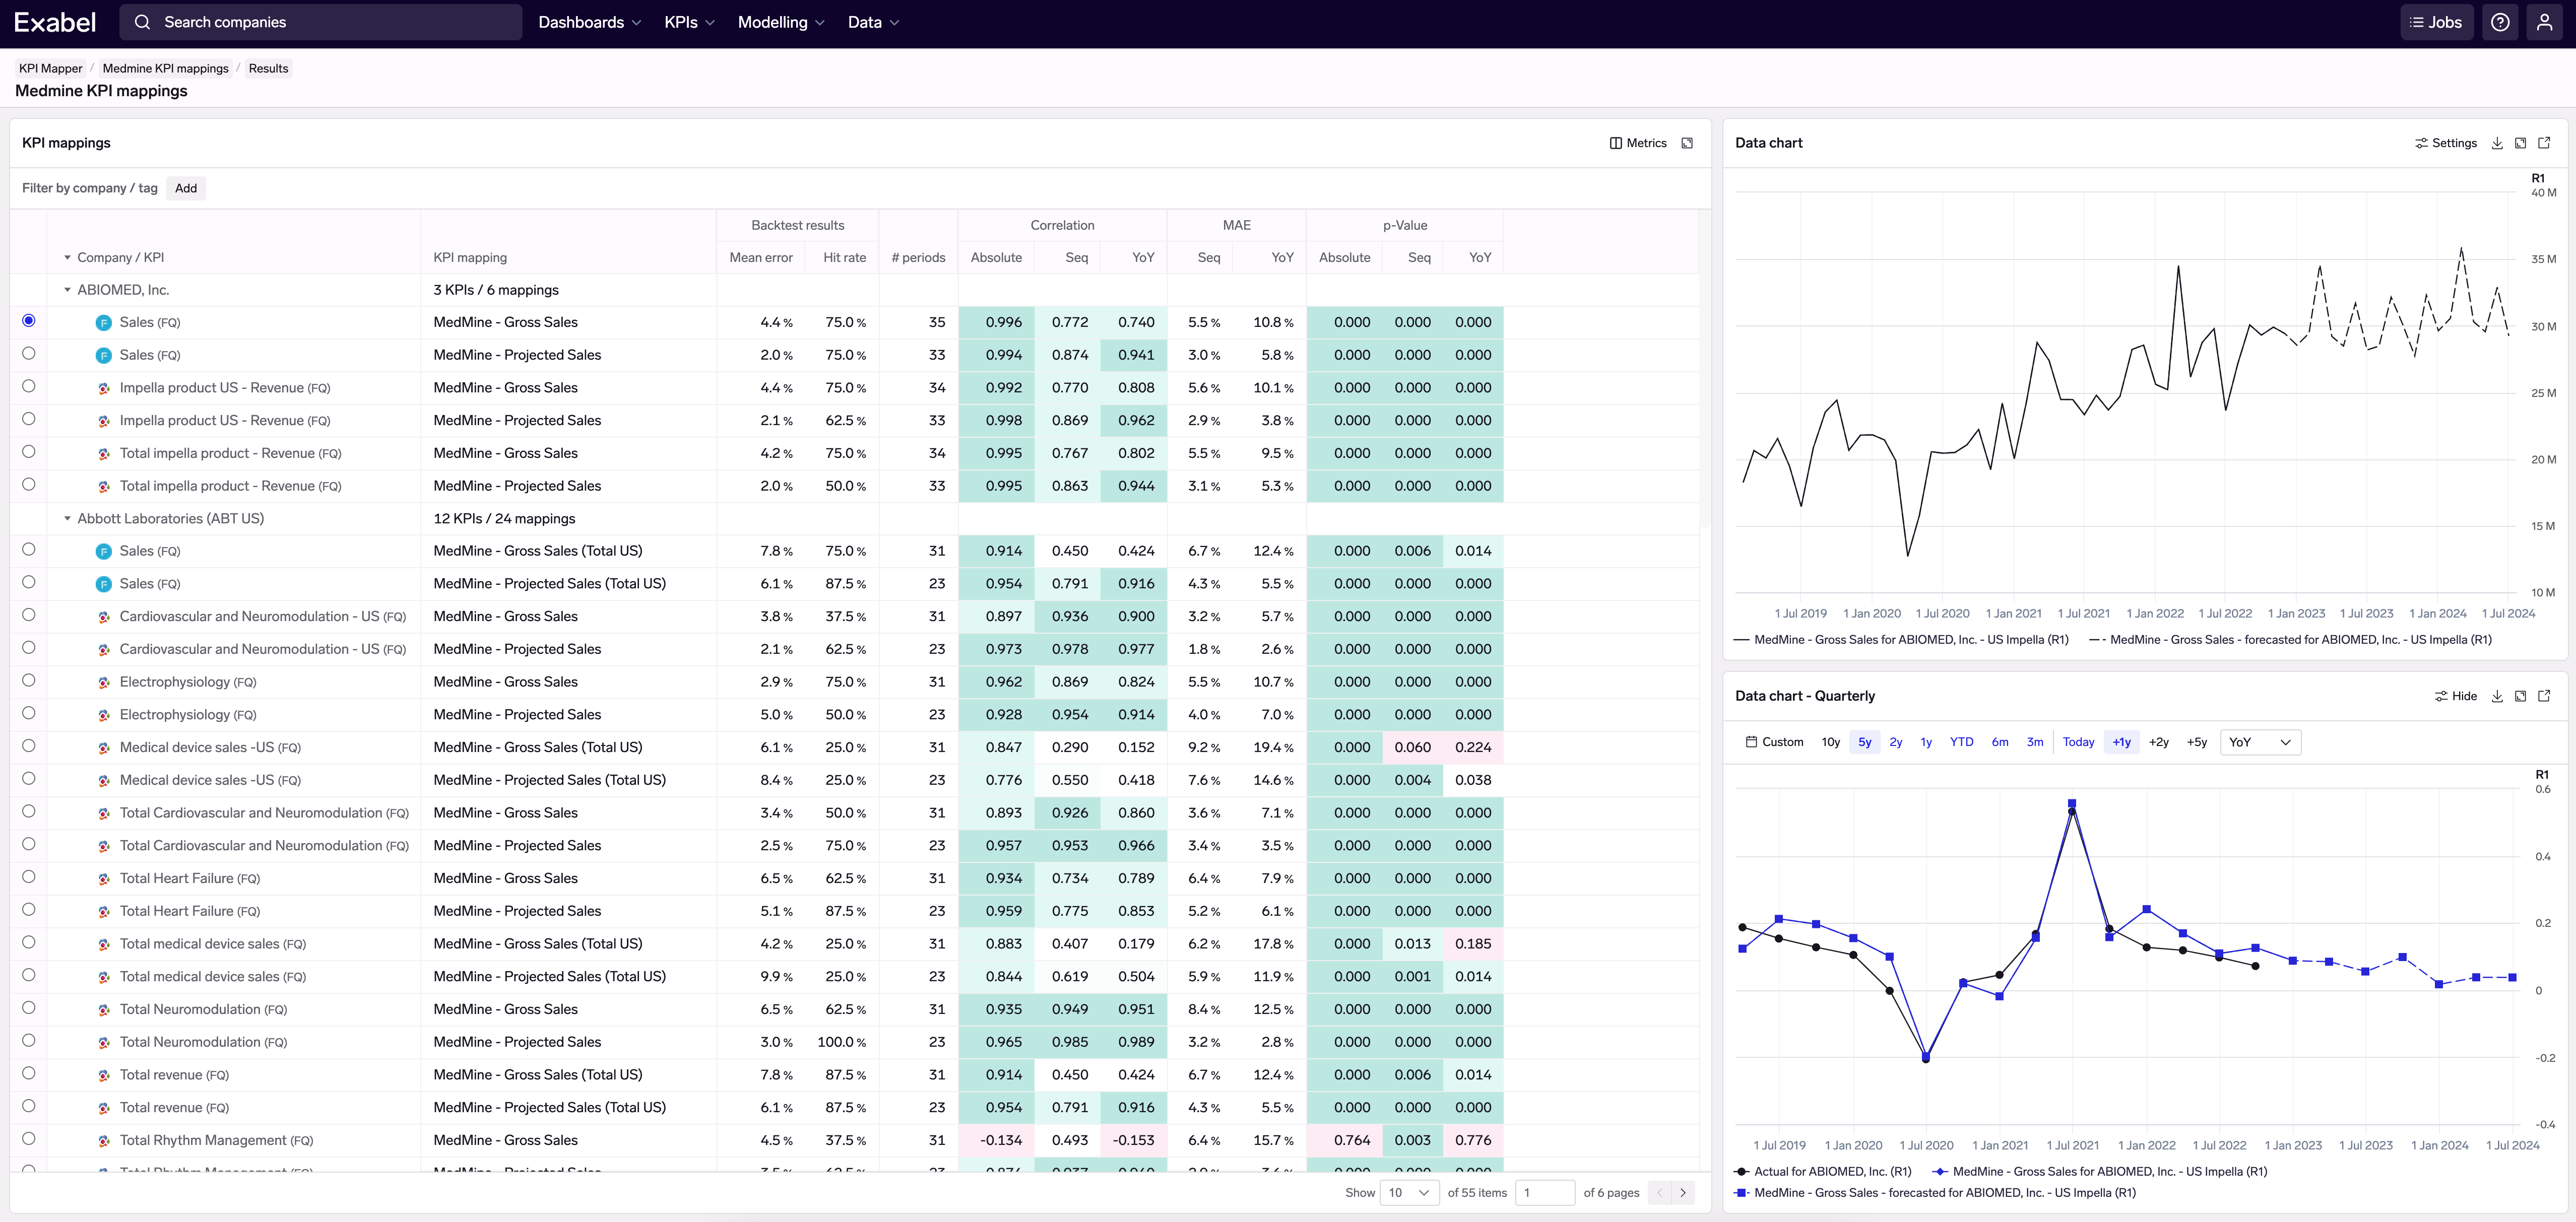
Viewing results across all companies in a KPI mapping collection
Other new features
- Data Explorer: Currencies for Visible Alpha are now displayed in the time series table.
- DSL: New
kpi_proxy()function that retrieves the proxy time series from a KPI mapping group. - DSL: New
point_in_time()function that evaluates each data point with a point-in-time date equal to the date of the data point, optionally shifted a specified number of days before or after. Note that this function currently only supports a limited set of underlying signals. - DSL: New
smooth()function which makes it easy to create a smoothed version of a signal. This can be useful to apply to KPI mapping proxy signals, both to make the resulting charts cleaner, and to make the forecasting more stable with less volatile model revisions. - DSL: New
drop_last()function, which can be used to remove the last data point(s) from a time series. - Import Jobs: Added support to map relationships and time series to companies using CUSIP, and to securities using ISIN, MIC and ticker, or CUSIP.
- Import Jobs: Added support to replace all existing known times for provided data points.
- Portfolio Strategies: It is now possible to specify the maximum allocation to each company with a signal, so that the allocation limit can be given for example in terms of average daily trade volume or market cap.
- Portfolio Strategies: It is now possible to specify a delay that is applied to all alpha signals, to account for the delay in processing and delivering of the underlying data, as a convenience method instead of having to create separate signals that apply the delay in the DSL.
- Portfolio Strategies: It is now possible to specify the amount of forward fill that is applied to the alpha signals (previously, this was always 124 days).
Improvements
- KPI Analyzer: Display fiscal period (e.g. "4Q-2023") in addition to the fiscal period end date.
- Signal Explorer: Sharing charts will include all chart settings, and produce much shorter URLs.
- Charts: It is now possible to export cross-sectional aggregations.
- Charts: It is now possible to select separate colours for positive and negative values.
- Charts: It is now possible to hide the company/entity in the legend. This is configurable in chart signal settings.
- Charts: It is now possible to select different legend layout options - "horizontal", "vertical", or "proximate".
- Dashboards: Increased the maximum number of widget groups to 10.
- Drill-downs: When creating public sharing links, the default expiry is now extended to 180 days.
- Prediction models: Skip some checks before the Run model button is enabled, making it faster to run models from the user interface. We recommend using the Validate button instead to check your model settings and inputs.
- Portfolio Strategies: Increased the maximum number of displayed backtests to 1000.
- Portfolio Strategies: The factor analysis now calculates the exposure and the actual return contribution from each quantile of each style factor.
- Screener: Moved the menu item from the "Data" menu to the "Strategies" menu.
- Analytics API: Run prediction model will always load current signal library, also using the active or a specified run configuration, to reflect how prediction models are run using the UI.
- Data API: Private companies with indirect time series through ownership relationships are added to the Exabel company search universe.
Bug fixes
- Signal Explorer: Enable "Download data" menu item in table view for users with the data export permission.
- Dashboards: Fixed a regression issue where table columns could not be toggled on/off.
- Charts: Fixed an issue where the current date was not included when using "today" as interval end.
- KPI Analyzer: Fixed an issue where unsaved mappings were not removed from charts when deleted.
- KPI Mapper: Fixed an issue when creating or editing a company specific KPI mapping when viewing a different page than the first page.
- Prediction models: Fixed the timestamp in the header for a model run to be in local time zone instead of UTC.