February 2024 update
This month, we introduced customizable model weights in the KPI Analyzer, allowing more control for advanced users. Also, new probability distribution charts aid in visualizing KPI prediction uncertainty. Other improvements include relative and rolling consensus revisions, error alerts and live logs in Import Jobs, streamlined UI enhancements, and various bug fixes.
New features
KPI Analyzer - custom model weights & probability distribution
It is now possible to specify the weights for each KPI mapping when training a custom KPI model. This is useful when you have a strong intuition about the relative strength of your data, and want to fix weights rather than let the model auto-assign weights. You can specify weights on some or all of the selected mappings; any mappings with unspecified weights will be automatically assigned.
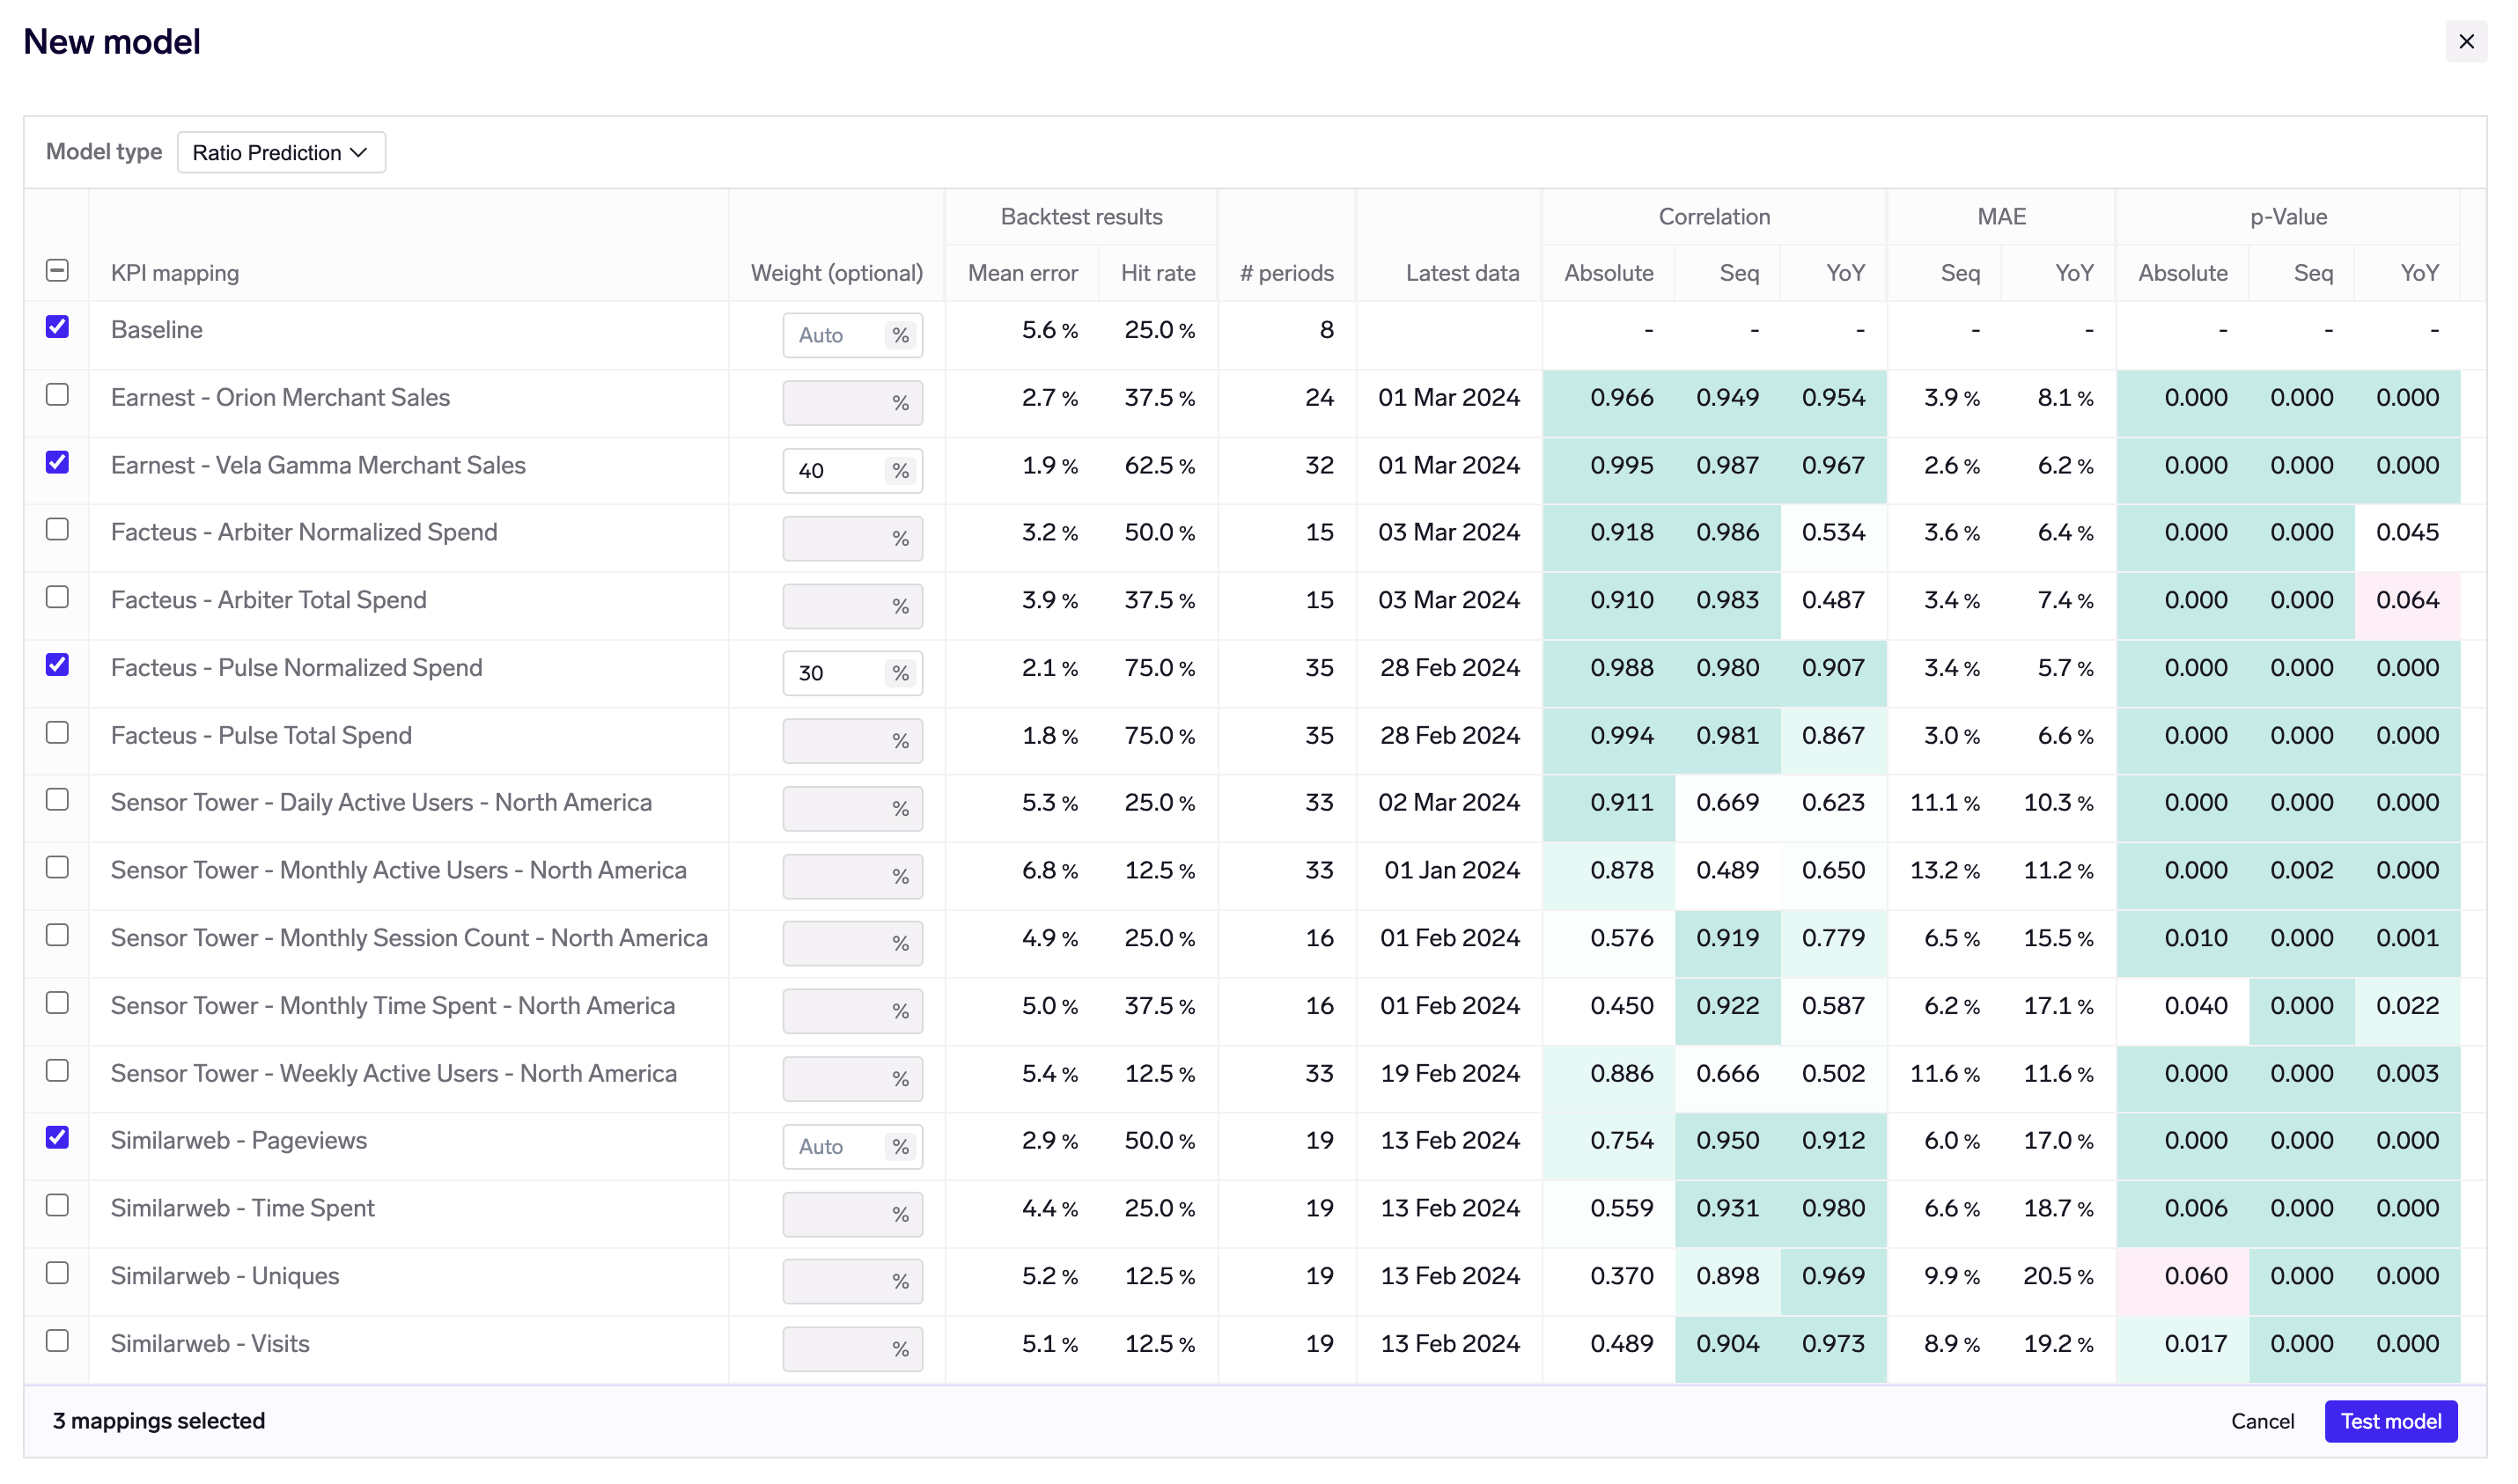
Specifying model weights when training a custom model
We have also introduced a new probability distribution chart widget to help more easily visualize the uncertainty around each KPI prediction. The consensus distribution is also calculated on a like-for-like basis, looking at the historical consensus error vs the reported KPI.
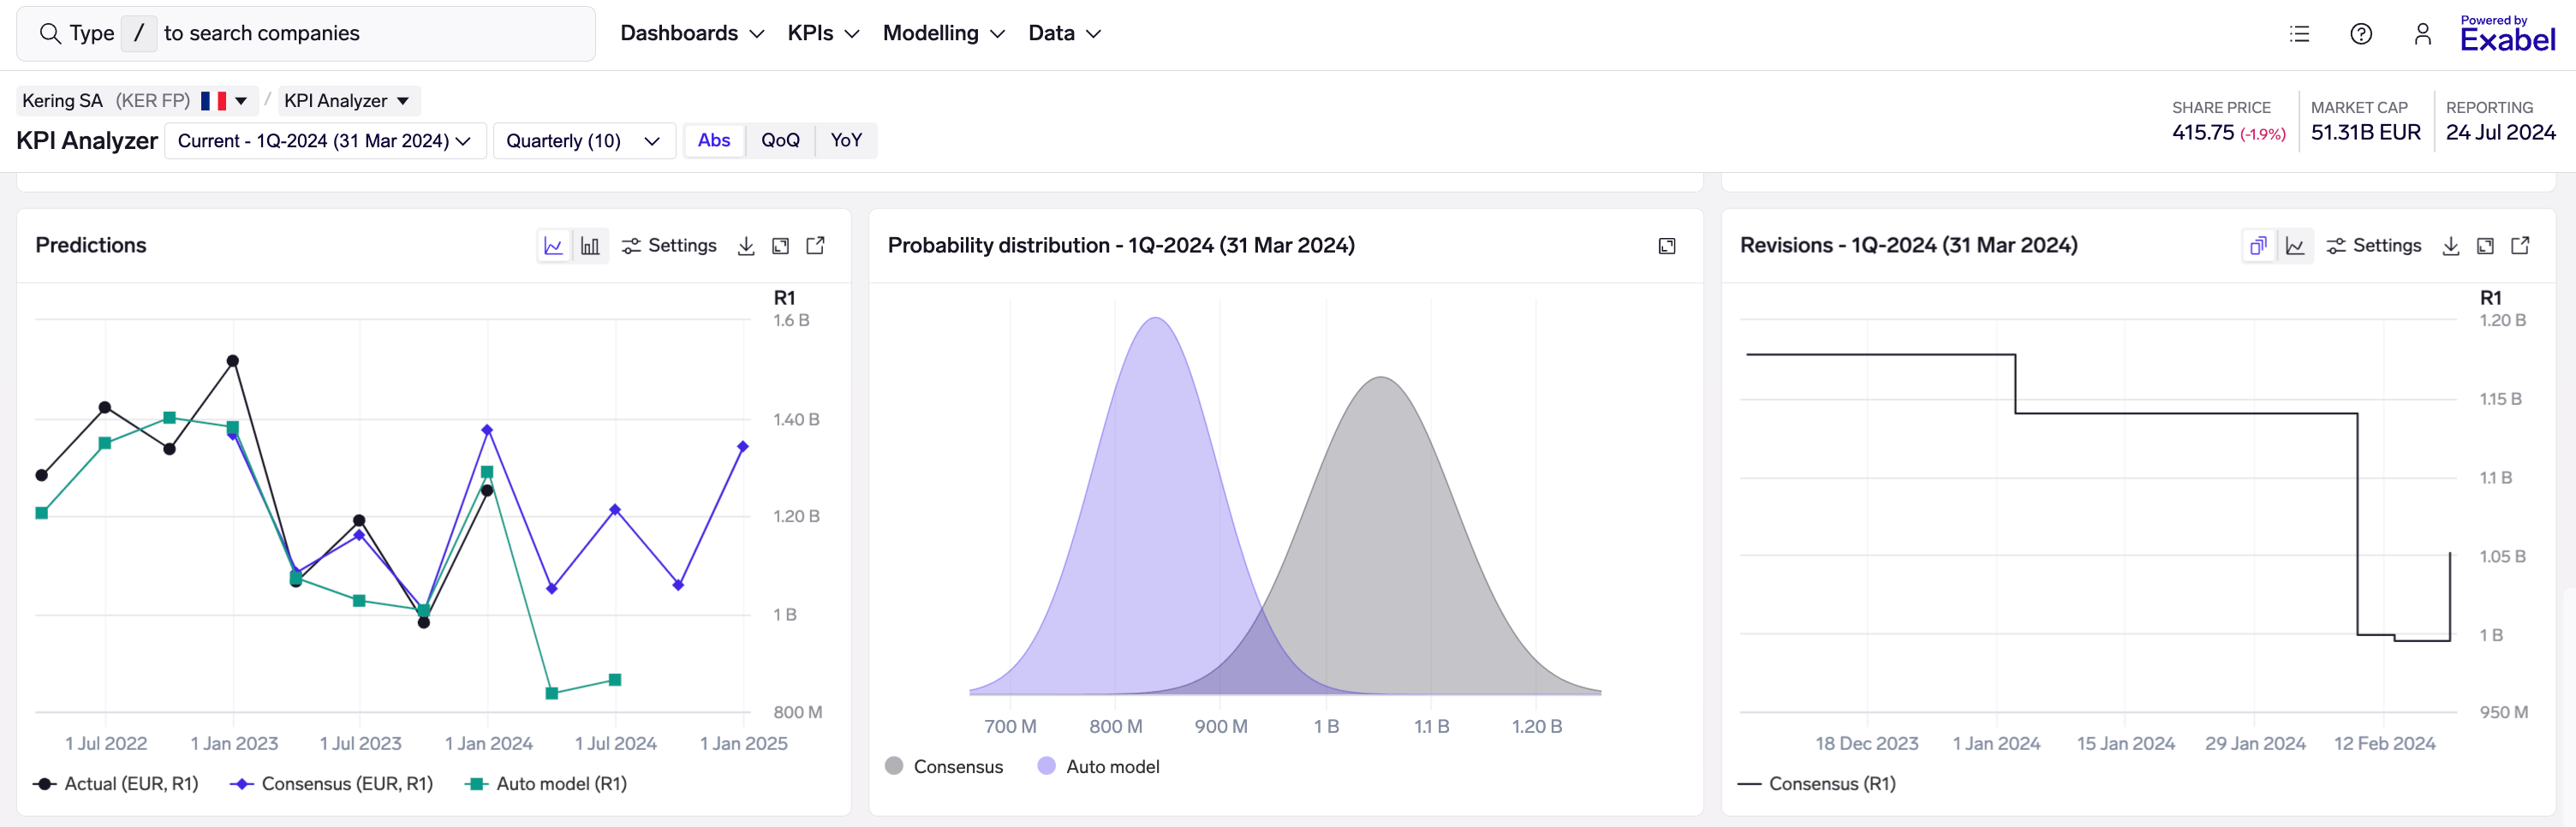
Probability distribution showing a significant predicted miss
Relative and rolling consensus revisions
It is now possible to retrieve consensus revisions for relative periods (e.g. FY1 sales) and also on a rolling basis. This is enabled now in the fs_revisions() and va_revisions() functions for FactSet and Visible Alpha respectively.
Relative periods allow you to set up charts to monitor revisions for the current / next quarter or year, without having to hardcode the specific fiscal quarter or year in your signal expression. For example, the "FY1" relative period always refers to the current fiscal year, based on today's date; as time passes and we enter into a new fiscal year, the signal will automatically start showing revisions for that fiscal year, which is now the current year.
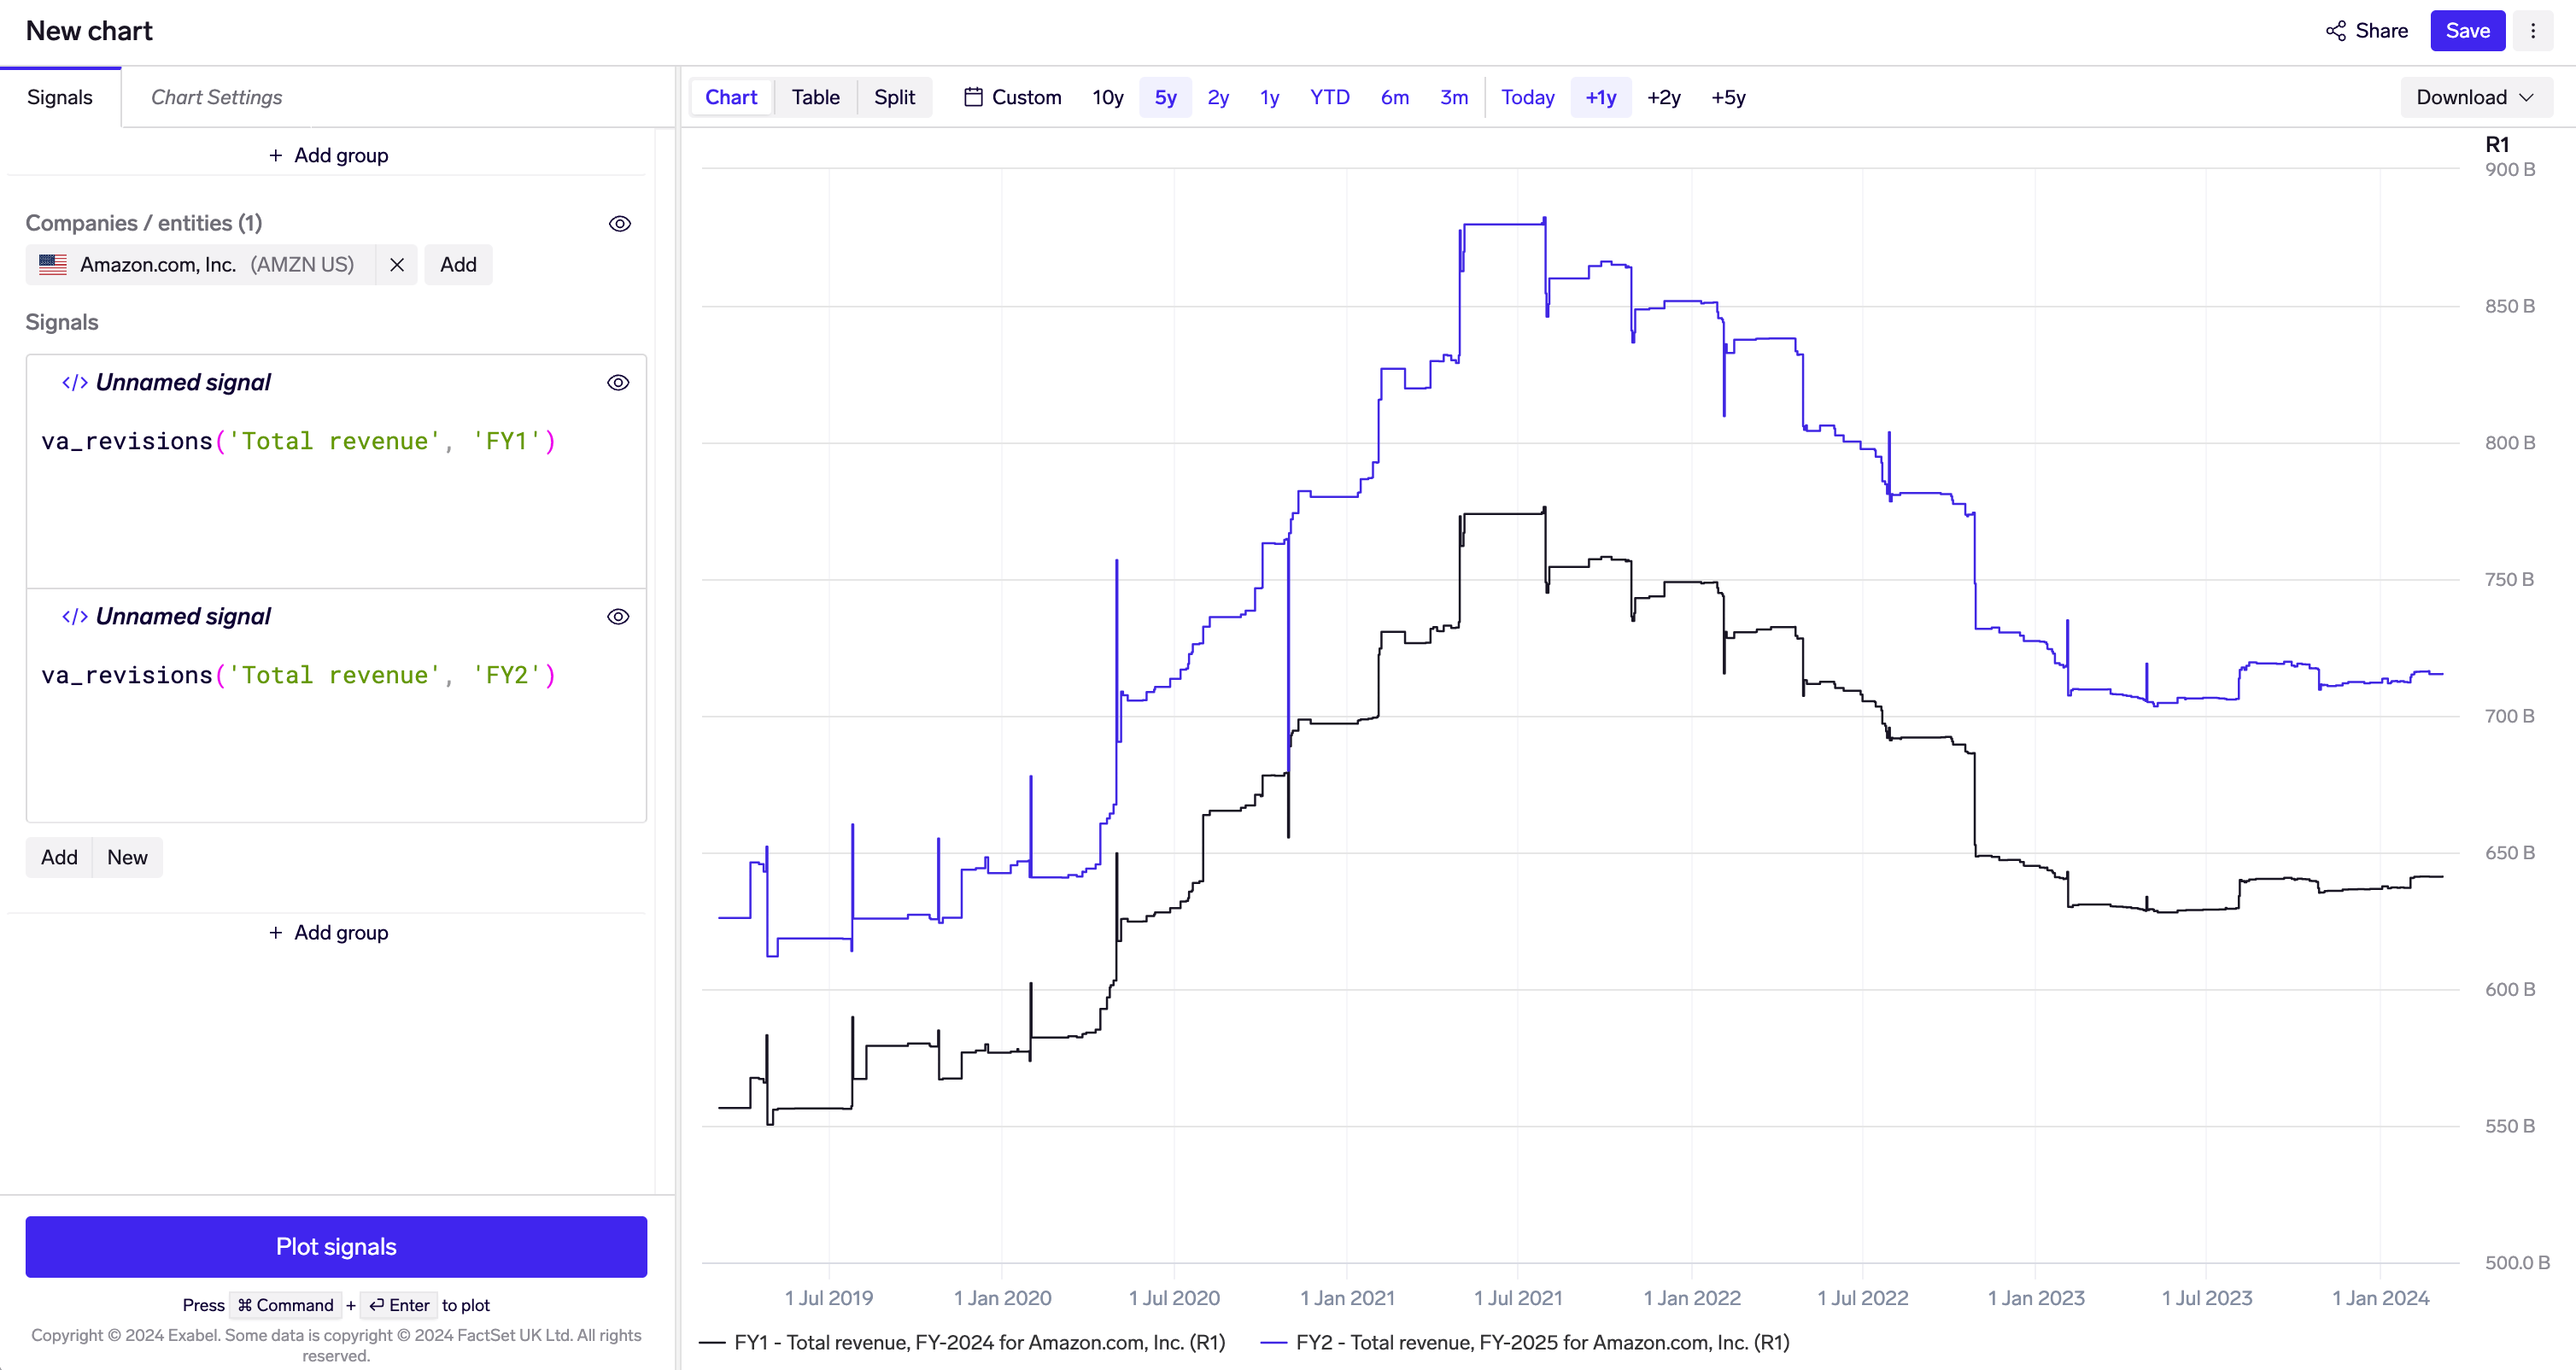
Relative period: FY1 and FY2 Visible Alpha Total revenue revisions for Amazon. As of today (5 March 2024), FY1 refers to FY-2024, but from 1 Jan 2025 it will start referring to FY-2025.
Rolling revisions allow you to visualize current / next quarter or year estimate revisions, but where the revision time series rolls over to the next period at the period-end date. This allows for visualization of the growth / change in a KPI over many years, alongside intra-period revisions. For example, the "GY1" rolling period refers to the current fiscal year for all dates in that fiscal year.
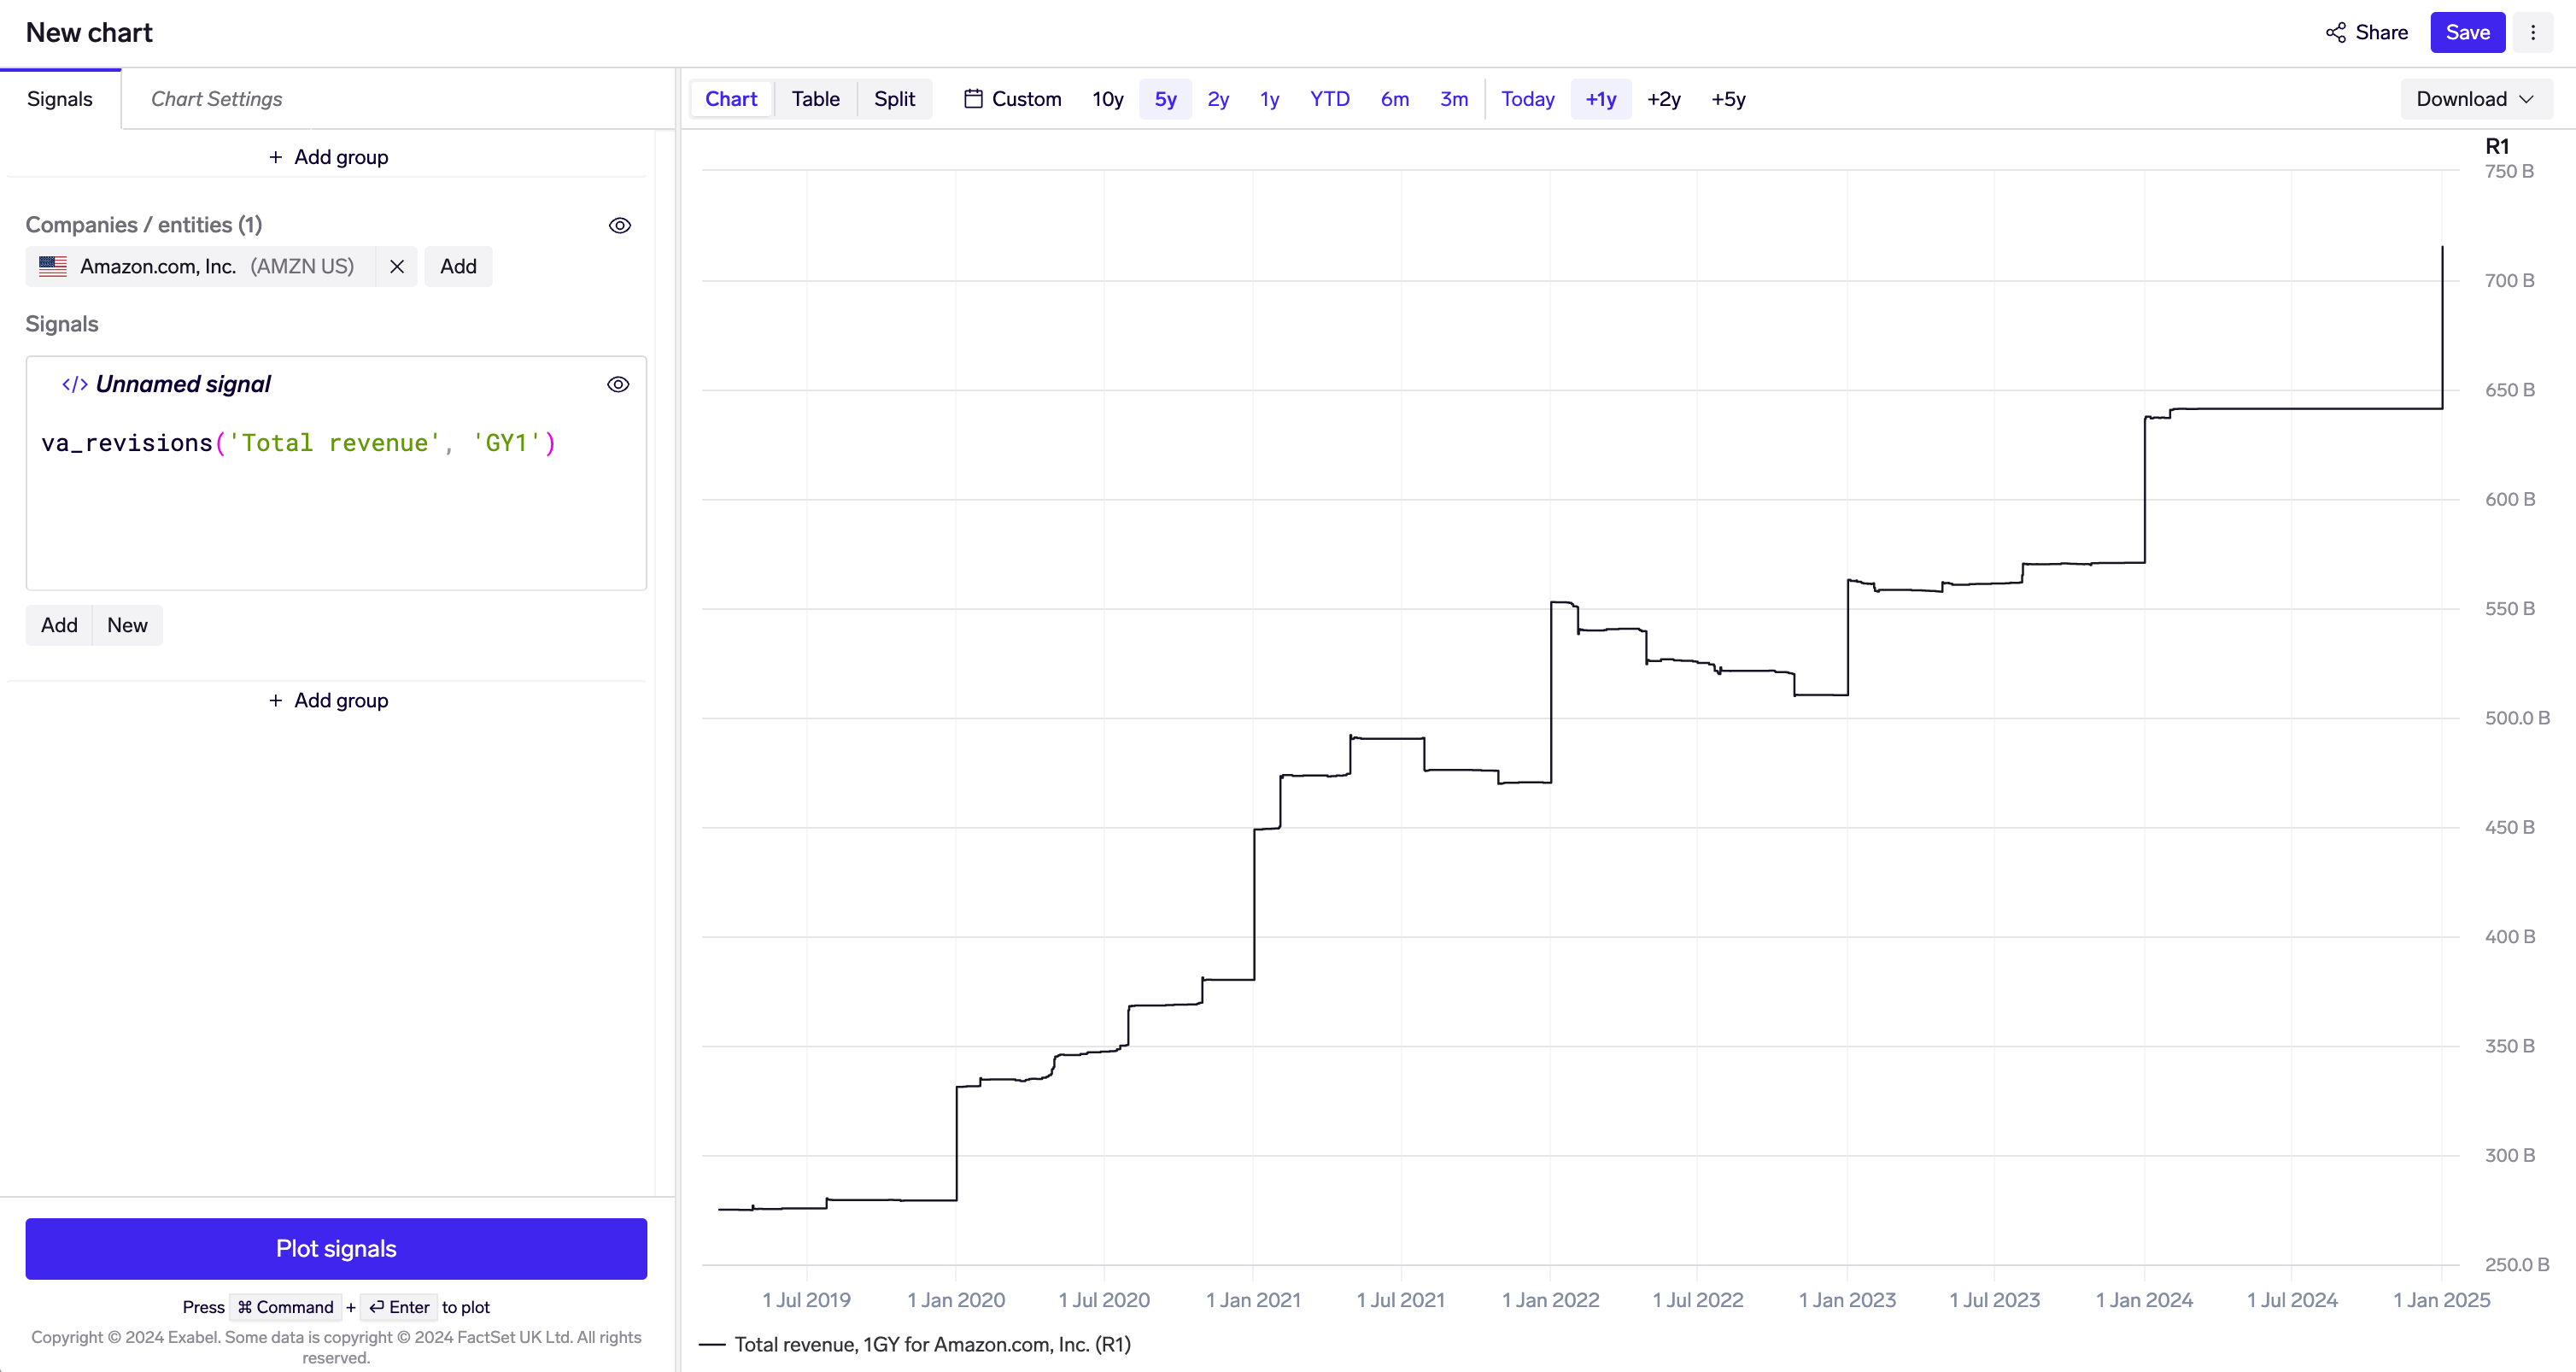
Rolling revisions: GY1 Visible Alpha Total revenue revisions for Amazon. Amazon has a 1 Jan - 31 Dec fiscal year, so from 1 Jan - 31 Dec 2022, GY1 shows FY-2022 revisions (note progressive downgrades over the course of that year), while from 1 Jan - 31 Dec 2023, GY1 shows FY-2023 revisions.
Enhancements
- KPI Analyzer
- Clicking the KPI or KPI mapping in tables now selects it.
- Data charts now use separate Y-axes if signals would be on different scales.
- Forecasted data series are now linked with actual data series in charts, and show up only once in the legend.
- Simplified chart legends by hiding the company name.
- Optimized loading speed
- KPI Mapper
- It is now possible to select a set of company-specific mappings and delete them in bulk.
- Company-specific mappings that are read-only (e.g. those from vendors) can be inspected.
- Dashboards: Clicking the company / entity cell in tables now selects it. Links to a related drill-down now appear in a floating menu when you mouseover the company / entity.
- Charts: Exclude partial periods when aggregating data in quick transforms.
- Data Explorer: Show only entity types that are owned by the company, in the company-centric Data Explorer.
- DSL: Retrieving Visible Alpha data via signals is much faster.
- Company search: Reduced flashing / jumping while searching.
- Import jobs
- It is now possible to set one or more email addresses to receive alerts about failed import job runs. See the user guide for details.
- It is now possible view the log of a stage while it is running.
- Python SDK: Released version 5.1.0, with support for importing entity descriptions and automatic retries when exporting data.
Bug fixes
- KPI Analyzer: Fixed an edge case where results were not shown when a company reports semi-annually but all KPI mappings & models are on quarterly KPIs.
- KPI Analyzer: Fixed an issue in the edit KPI mapping form where pressing Enter did not save the changes.
- KPI Mapper: Fixed an issue when viewing a company-specific KPI mapping reset the company filter.
- Drill-downs: Fixed an issue where the chart legend would show the resource name (rather than display name) of companies or entities, when adding a company or entity for comparison.
- Prediction models: Fixed UI display bugs when opening models built in the KPI Analyzer.
- Alpha tester: Fixed a rounding issue with presenting bps in the UI.
- DSL: Fixed bug where
signal.moving_average()was affected by being evaluated with other entities.