May 2023 update
This month's product release introduces exciting new features such as dashboards with linked widgets, allowing users to easily view corresponding data for selected companies across multiple widgets. Additionally, a new version of the Data Explorer provides a visual representation of the data model and enhances browsing, filtering, and search capabilities. New DSL functions have also been introduced to make it easier to retrieve, traverse, filter and segment your alternative data.
New features
Dashboards with linked widgets
Tables, charts and financial models can now be linked via groups in a dashboard. This allows users to select companies in one widget and see the corresponding data for that company in all the linked widgets.
Interactive dashboard with linked chart widgets showing key metrics for each selected company. Multiple companies may be also selected for comparison.
Requires Insights Plus or Full PlatformEditing dashboards, including linking widgets, requires the Insights Plus or Full Platform plans. You must also have write access to a dashboard.
If you are consuming a read-only dashboard created by a data vendor or by Exabel, and have the required plan, you may save a copy and customize it to your liking.
Widgets may be linked with the link icon  in the top-left corner. Linked widgets are indicated with a letter
  . Tables may be toggled between single / multiple selection in the bottom-left corner, which will enable users to make comparisons of companies / entities in the linked charts.
New Data Explorer
Just over a year ago, we launched the Data Explorer feature to allow for easier browsing and searching across your imported data and vendor data. We've now iterated and improved on that with a new version of Data Explorer, which provides a visual "graph" representation of the data model in each data set and allows for a richer browsing, filtering and search experience.
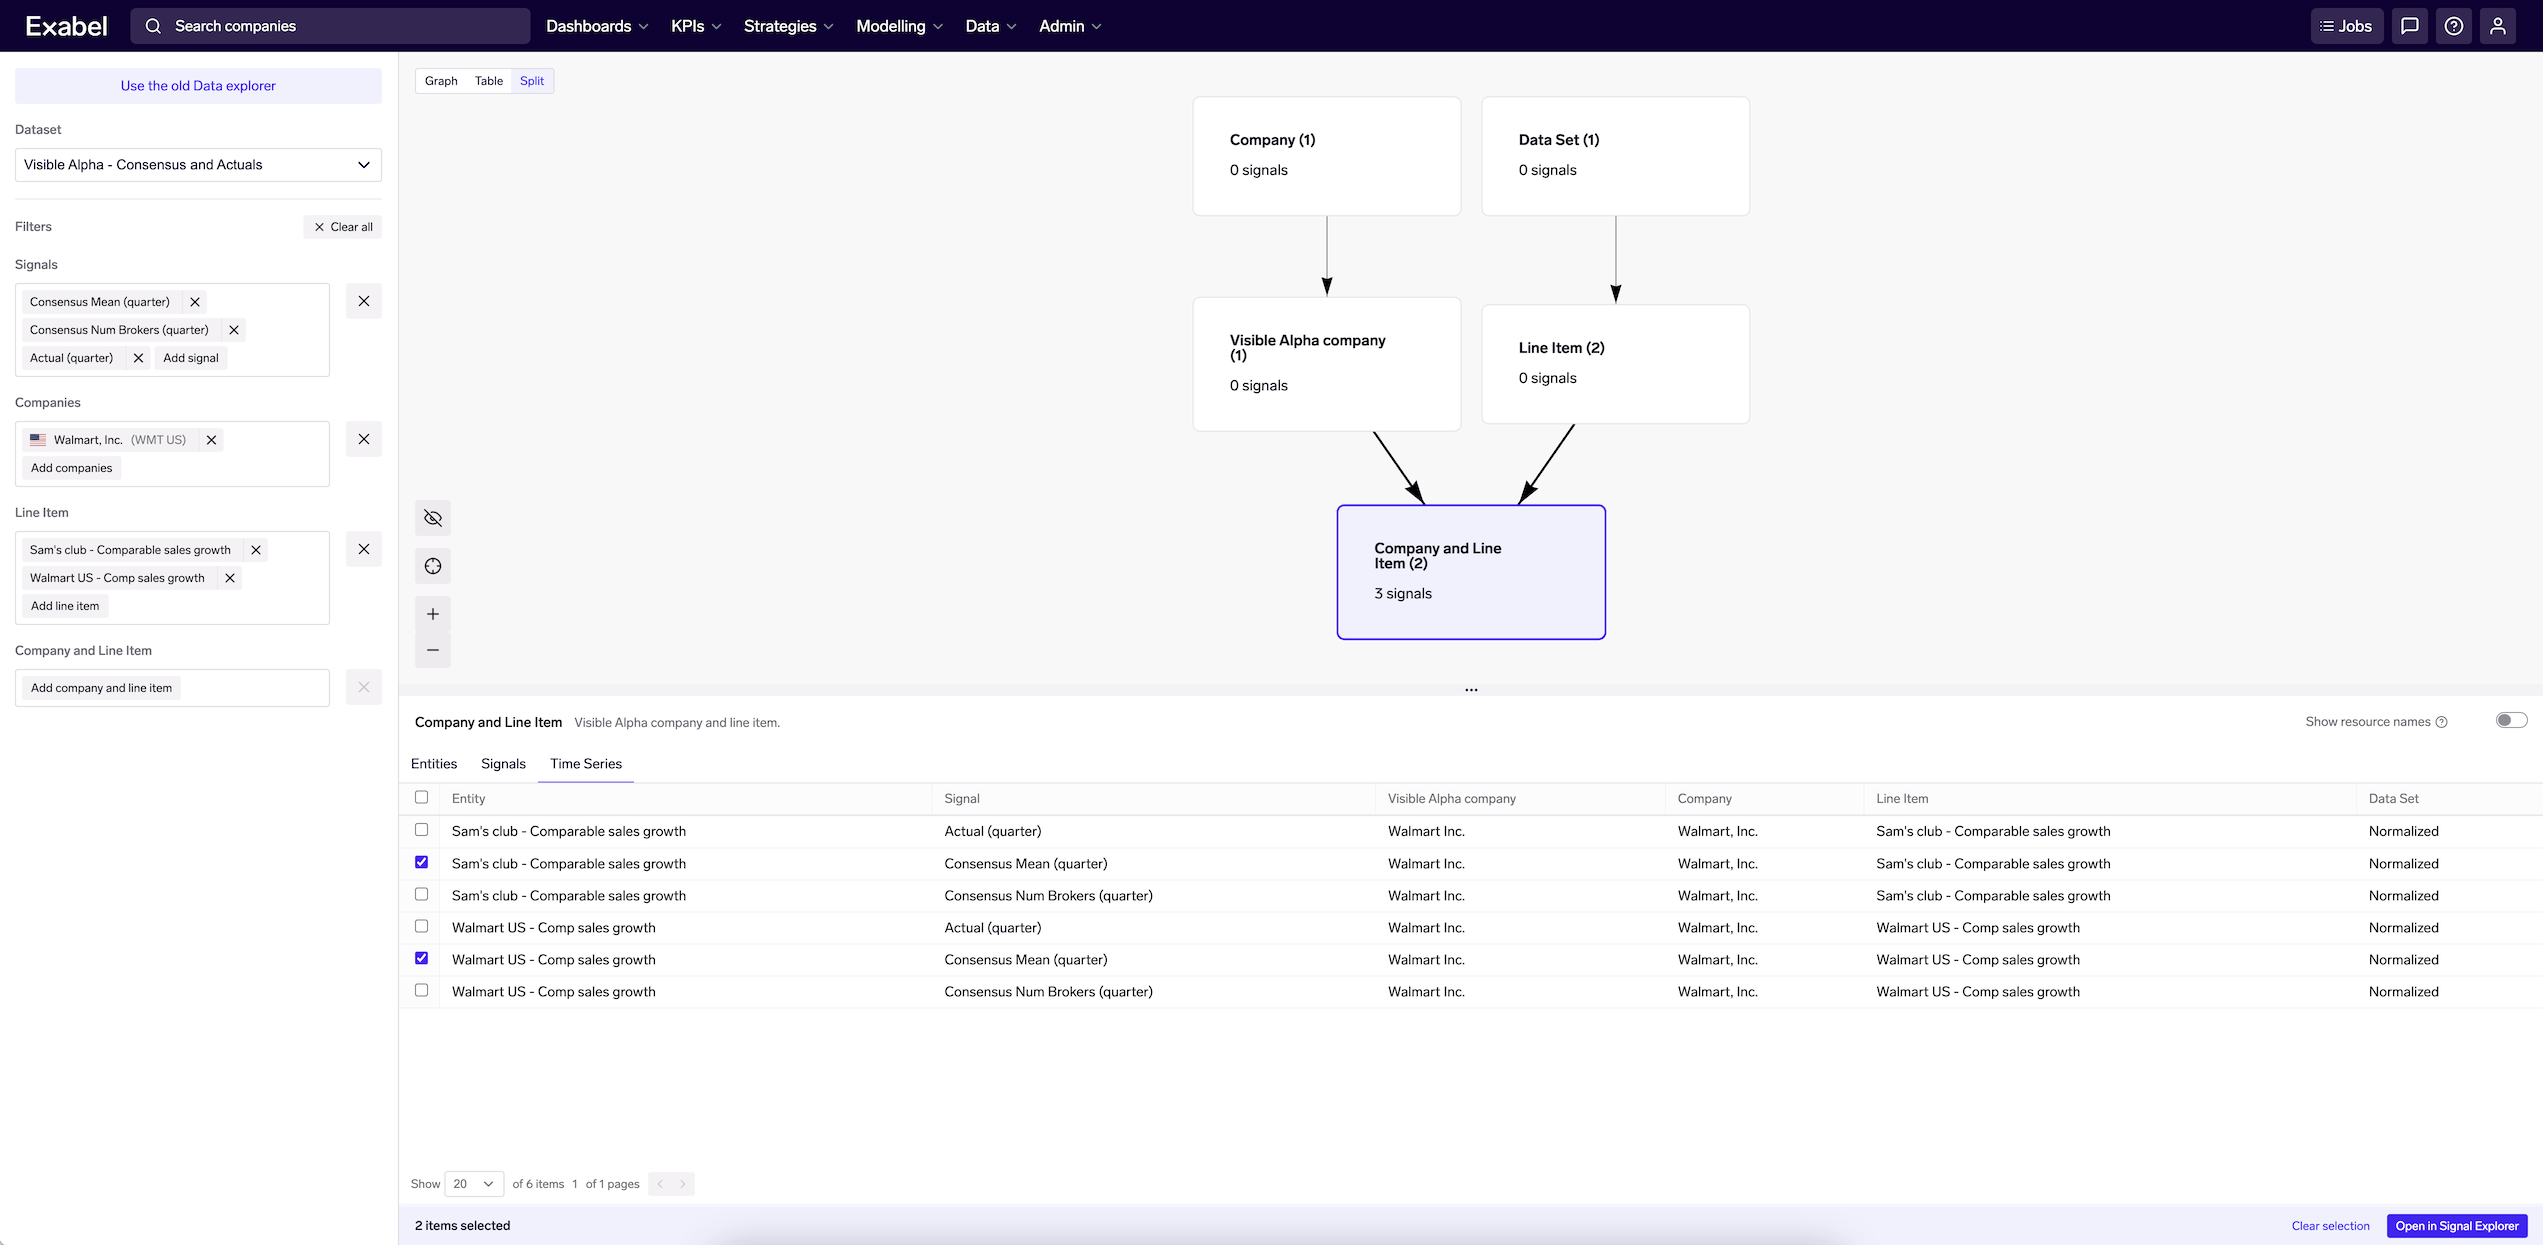
Browsing and filtering the Visible Alpha data set in Data Explorer
Click on each entity type (company, brand / merchant, web domain, etc) in your data model to browse the entities, signals and time series in that part of the data model. You may also interactively apply filters at different levels. For example, in the Visible Alpha example above, we are filtering for Walmart, 2 specific comp sales line items, and signals for the quarterly actuals and consensus mean & broker count. We can then take these time series into Signal Explorer for further exploration.
Other new features
- DSL: new
data()function to retrieve raw time series - we recommend using this over the less intuitively namedgraph_signal(). - DSL: new graph functions that allow a signal expression to traverse, filter and group-by entities in the data model:
- Traverse (
for_type()) from the evaluation entity to another entity to retrieve time series: e.g. for a given company, retrieve card spend time series on its brands - Filter (
graph_filter()) for entities that are connected to the evaluation entity: e.g. for a given company, retrieve job listings time series, filtered for a specific occupation. - Group-by (
graph_group_by()) entities that are connected to the evaluation entity: e.g. for a given company, retrieve employee count time series, grouped by country.
- Traverse (
- DSL: For prediction models built with the "Optimize for high-value alternative data" configuration,
model_predictions()now produces predictions as far into the future as there are input values (up to two years), rather than just the next data point.
Improvements
- Charts: Allow users to save charts without entities.
- Dashboards: Improved logic for text wrapping in tables.
- Library: Added support for descriptions for library folders.
- Tags: Sort starred tags on top when selecting tags.
- Data API: Improved performance on listing relationships when no nodes are given.
- Analytics API: Support for specifying model configuration and auto-activate when triggering models runs.
Bug fixes
- Dashboards
- Respect ticker display option when sorting the company column.
- Fixed an issue when displaying old dashboards that did not have custom settings.
- Fixed an issue with filters not being interactive when tables were loading.
- Fixed an issue when the page had to be refreshed to load the most recent changes after making an update to a table.
- Data API: Fixed an issue when uploading a new signal (e.g. using
--case-sensitive-signal) when a signal with same name but different casing already exists, and automatic creation of derived signal and/or tag were enabled (usingcreateLibrarySignalorcreateTagrespectively).