February 2023 update
Improved Insights Platform landing pages; dashboards with financial models; improved company calendar and aggregation to fiscal periods; and more.
New features
Insights Platform landing pages
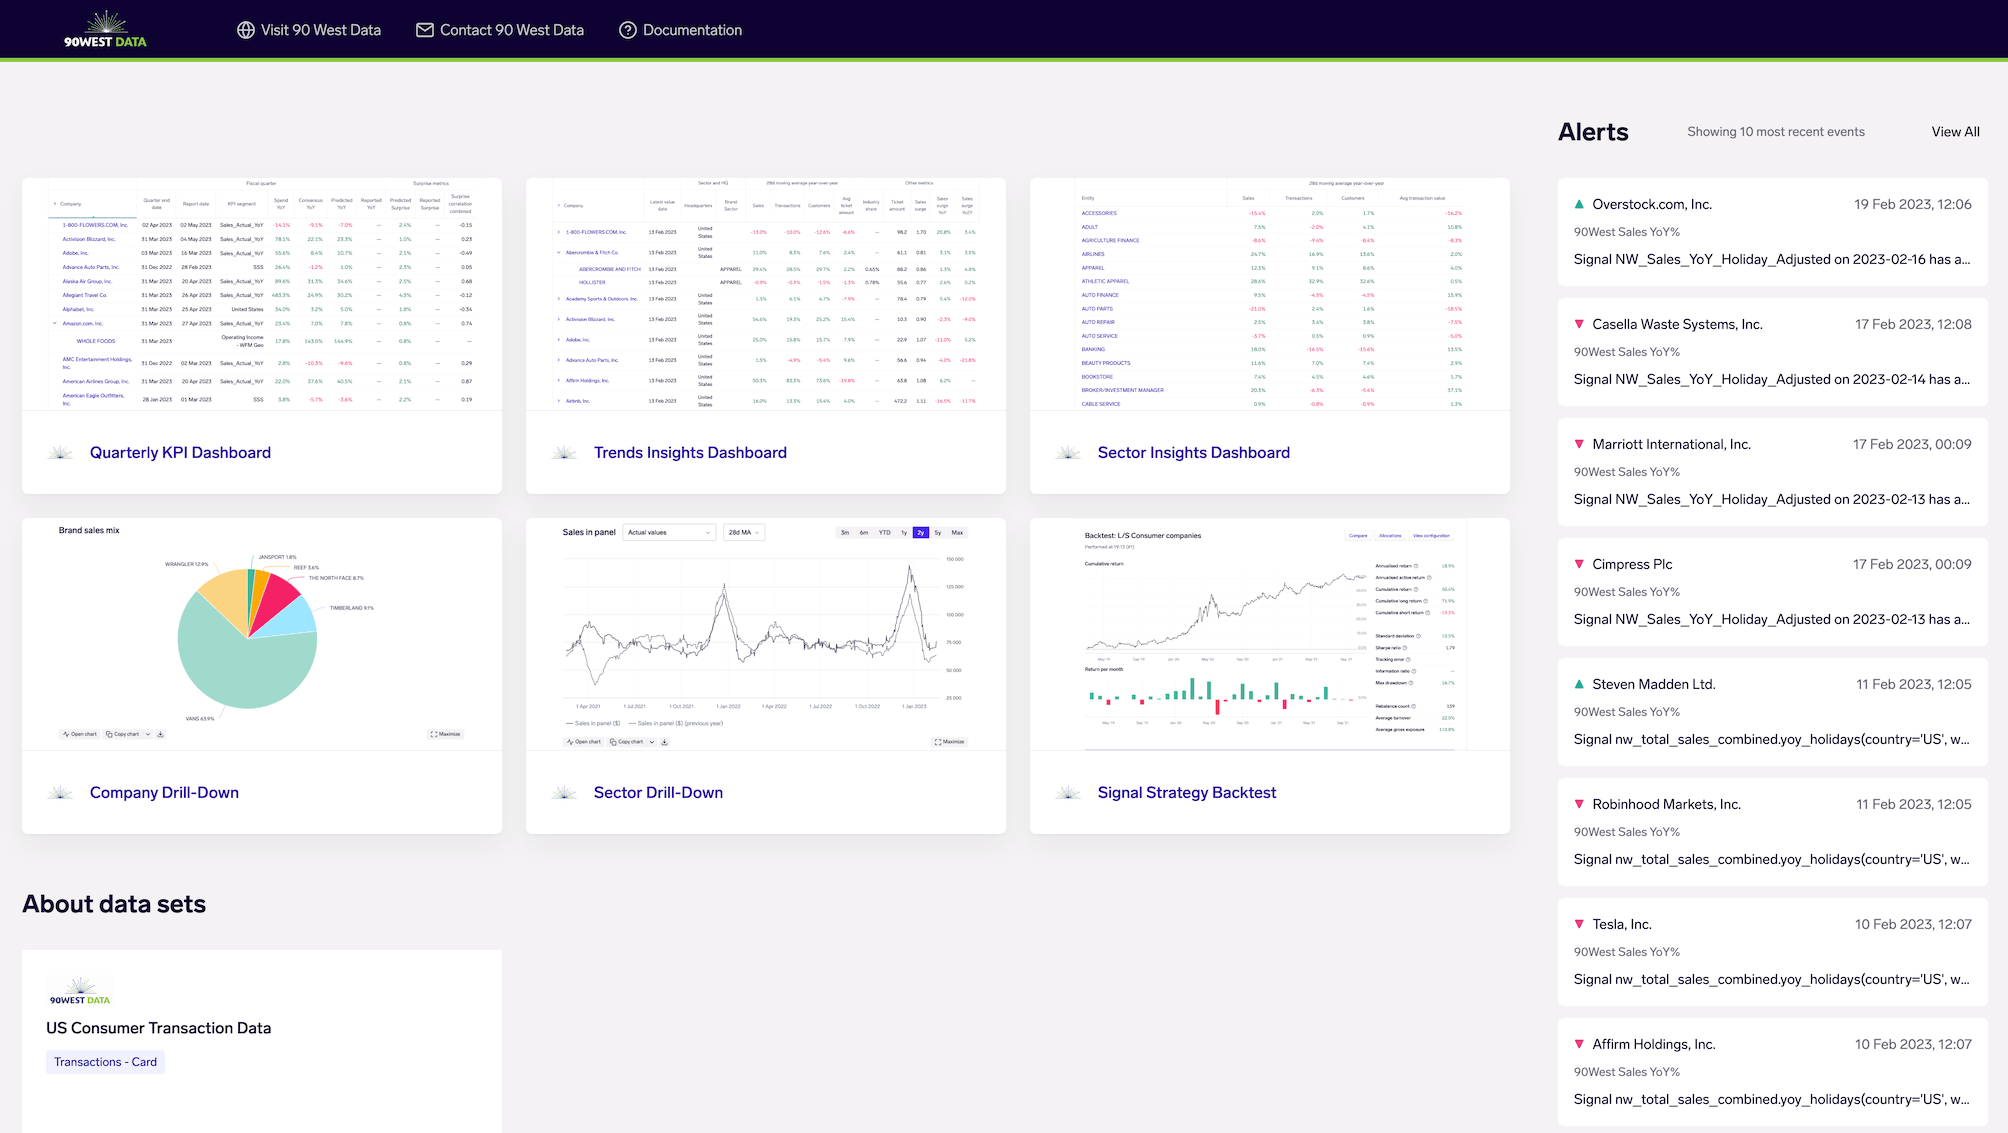
New Insights Platform landing pages with data sets and alerts
Landing pages now include an "About data sets" section that links to the data catalog listing, providing more details about the data set to users.
If data set alerts are configured for the Insights Platform, the most recent alert events are also displayed in a sidebar on the right, to help easily identify companies with significant changes or anomalies in the data.
Dashboards with financial models
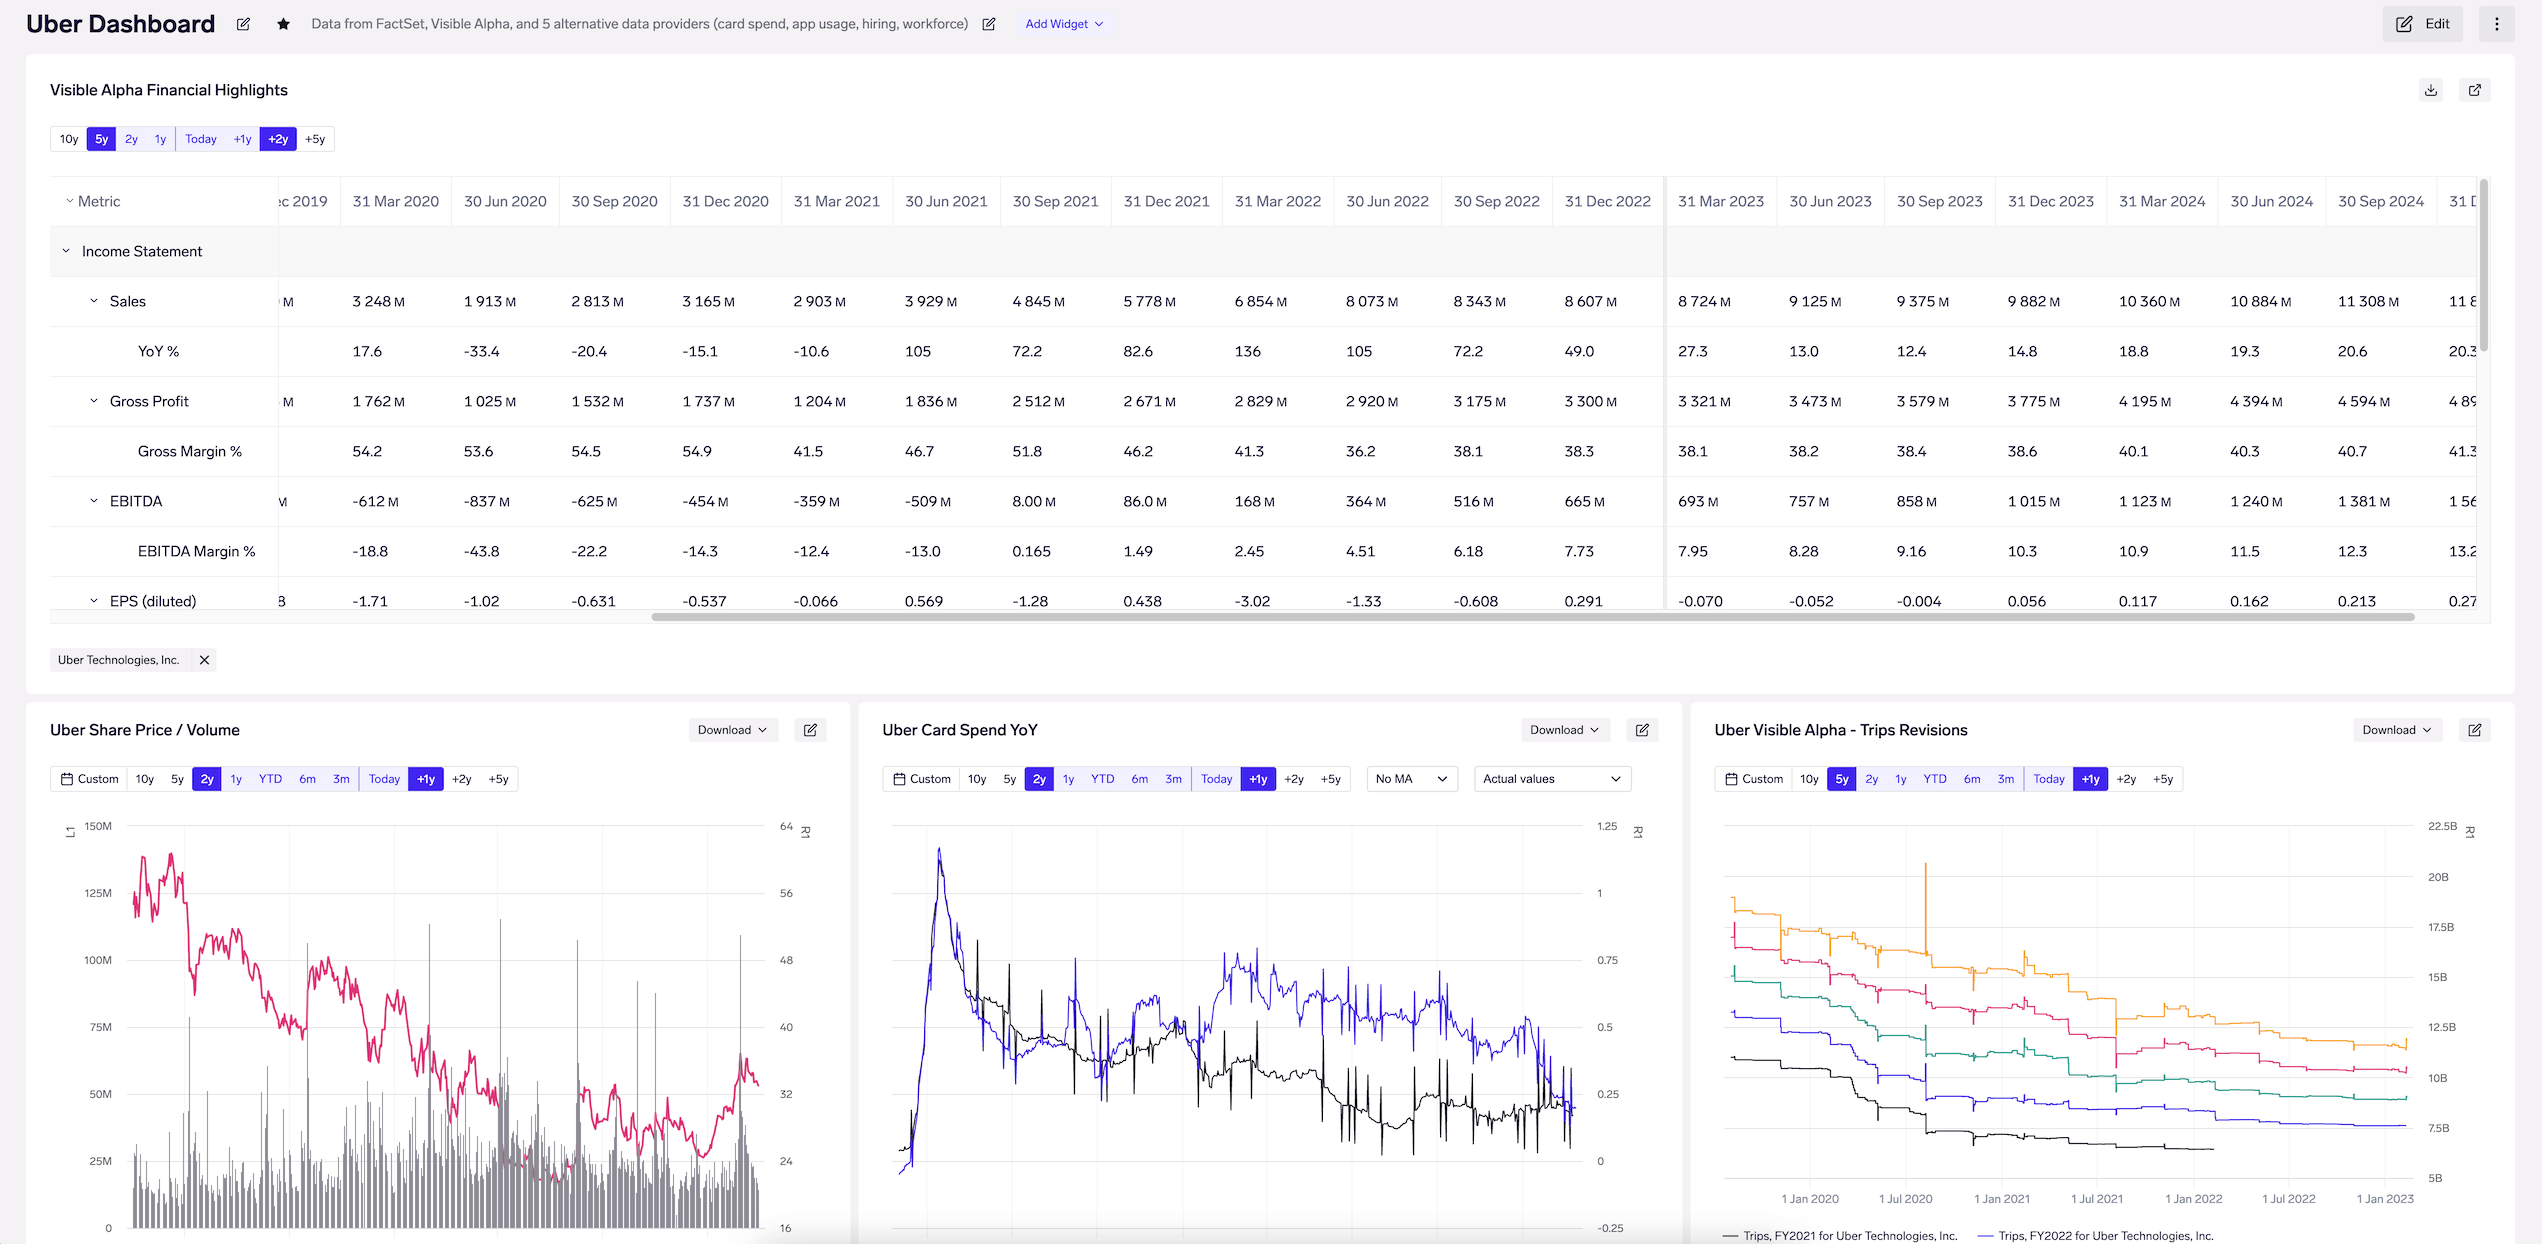
Dashboard with a financial model widget showing Visible Alpha actuals & consensus, alongside chart widgets combining data across multiple data providers
You may now add financial models to dashboards as widgets. Financial models are great for viewing fundamental, consensus and alternative data on a quarterly basis, and for mapping KPIs to your alternative data. This now allows you to easily view your models side-by-side with charts and tables of the underlying data.
To add a financial model widget, click on "Add widget" at the top of the dashboard screen (you must have write access to a dashboard). Then pick an existing financial model from your Library, and it will now appear in your dashboard. Finally, select a company that you want to view the financial model for - this may be changed at any time. You may also want to pick a widget layout and re-order widgets to suit your preferences, by clicking on "Edit" at the top of the dashboard screen.
Improved company calendars and aggregation to fiscal periods
We've recently released several major improvements to our signal expression language (DSL) for retrieving company calendars, aggregating alternative data to their fiscal periods, and calculating change including period-to-date change. Read the full announcement here.
- Company calendars: support for retrieving semi-annual and annual calendars, smart selection of quarterly vs semi-annual depending on the company, and more robust handling of missing data issues and company changes to reporting frequency.
- Aggregation: simplified syntax for aggregating to the new company calendar frequencies, including smart aggregation to quarters vs semi-annuals depending on the company.
- Aggregate change: simplified syntax to aggregate & calculate absolute/relative change in one operation, plus support for calculating period-to-date change.
Other new features
- Dashboards: new "Add widget" button to more quickly add charts and tables.
- Drill-downs: Where a parent entity is defined, this is now a clickable link for easier navigation to the parent entity.
- Sector tags: FactSet RBICS L1 - L4 tags may now be used in Signal Explorer, when picking companies, entities or tags to explore.
- DSL: A new
upsample()method for signals. This is useful as a first step when resampling between two frequencies which do not evenly divide each other - e.g. going from weekly to monthly or quarterly.upsample()allows you to first upsample to daily, then downsample to your desired frequency withresample(). - DSL: A new
fill_valueargument to thefilled_daily()method. This is useful if you have time series with data gaps, and want to fill with a specific value (e.g.0) instead of forward-filling the last value. - Subscriptions: Show users their current subscription plan, and options for upgrading. This is accessible from the app under the user settings menu.
- Management API: Added a new operation to search for library items. See the API reference for more details.
Improvements
- Dashboards: companies/entities on a table are now defined on the table widget, rather than at dashboard-level. This change allows users to have multiple table widgets with different sets of companies/entities. Tables now allow users to include individual companies/entities, in addition to tags.
- Dashboards: tables are now edited by clicking on the pencil icon on the table widget, rather than going through the dashboard configuration modal. Editing requires write-access to the dashboard.
- Dashboards: Display title on chart widgets.
- Dashboards: Allow adding descriptions to dashboards.
- Drill-downs: Add support for multi-line descriptions, and descriptions on table widgets.
- Signal explorer: When applying a transform to an existing expression, we now add parentheses where necessary.
- Signal Explorer: Made the download and correlation actions on signal groups more visible.
- Companies / entities / tags: New popover to display more detailed information about the company / entity / tag, including a copy action to make it easier to bring information to other features on the Exabel platform.
- Charts: Improve error messages when multiple users are concurrently editing a chart.
- Financial models: Improved error handling for rows with signal evaluation errors.
Deprecations
- Removed the legacy File Uploader - we had previously revamped the File Uploader in October 2022.
Bug fixes
- DSL: Fixed an issue in Visible Alpha actual/consensus where the numbers for some companies were misaligned to the wrong dates, in some edge case scenarios.
As part of this fix, we are now also able to return full Visible Alpha consensus indefinitely into the future, where available. (This was previously limited to ~10 years into the future.) - Dashboards: Fixed missing option in some cases, to toggle between company name / ticker.
- Dashboards: Fixed popup charts not displaying in some edge cases.
- Dashboards: Disabled edit action for charts if user does not have write permission.
- Prediction models: Fixed an issue where classification models would not produce a result for a date if the target signal did not have a value.
- Signal Explorer: Fixed download failing for signals that don't require a company/entity.
- Financial models: Fixed "Discard" action which was causing all rows to be removed.
- Financial models: Disabled drag & drop and deletion of rows while the row is evaluated to prevent issue with blank rows.
- Public sharing: Fixed styling issue with tables overflowing the page on narrow screens.
- Fix missing Star action on dashboards, prediction models and portfolio strategies for Insights Platform users.