Financial Models
Map KPIs to alternative data signals, combining data from multiple sources
Financial models allow you to map company KPIs to alternative data signals, combining data from multiple sources and aggregating it to a company's fiscal quarters.
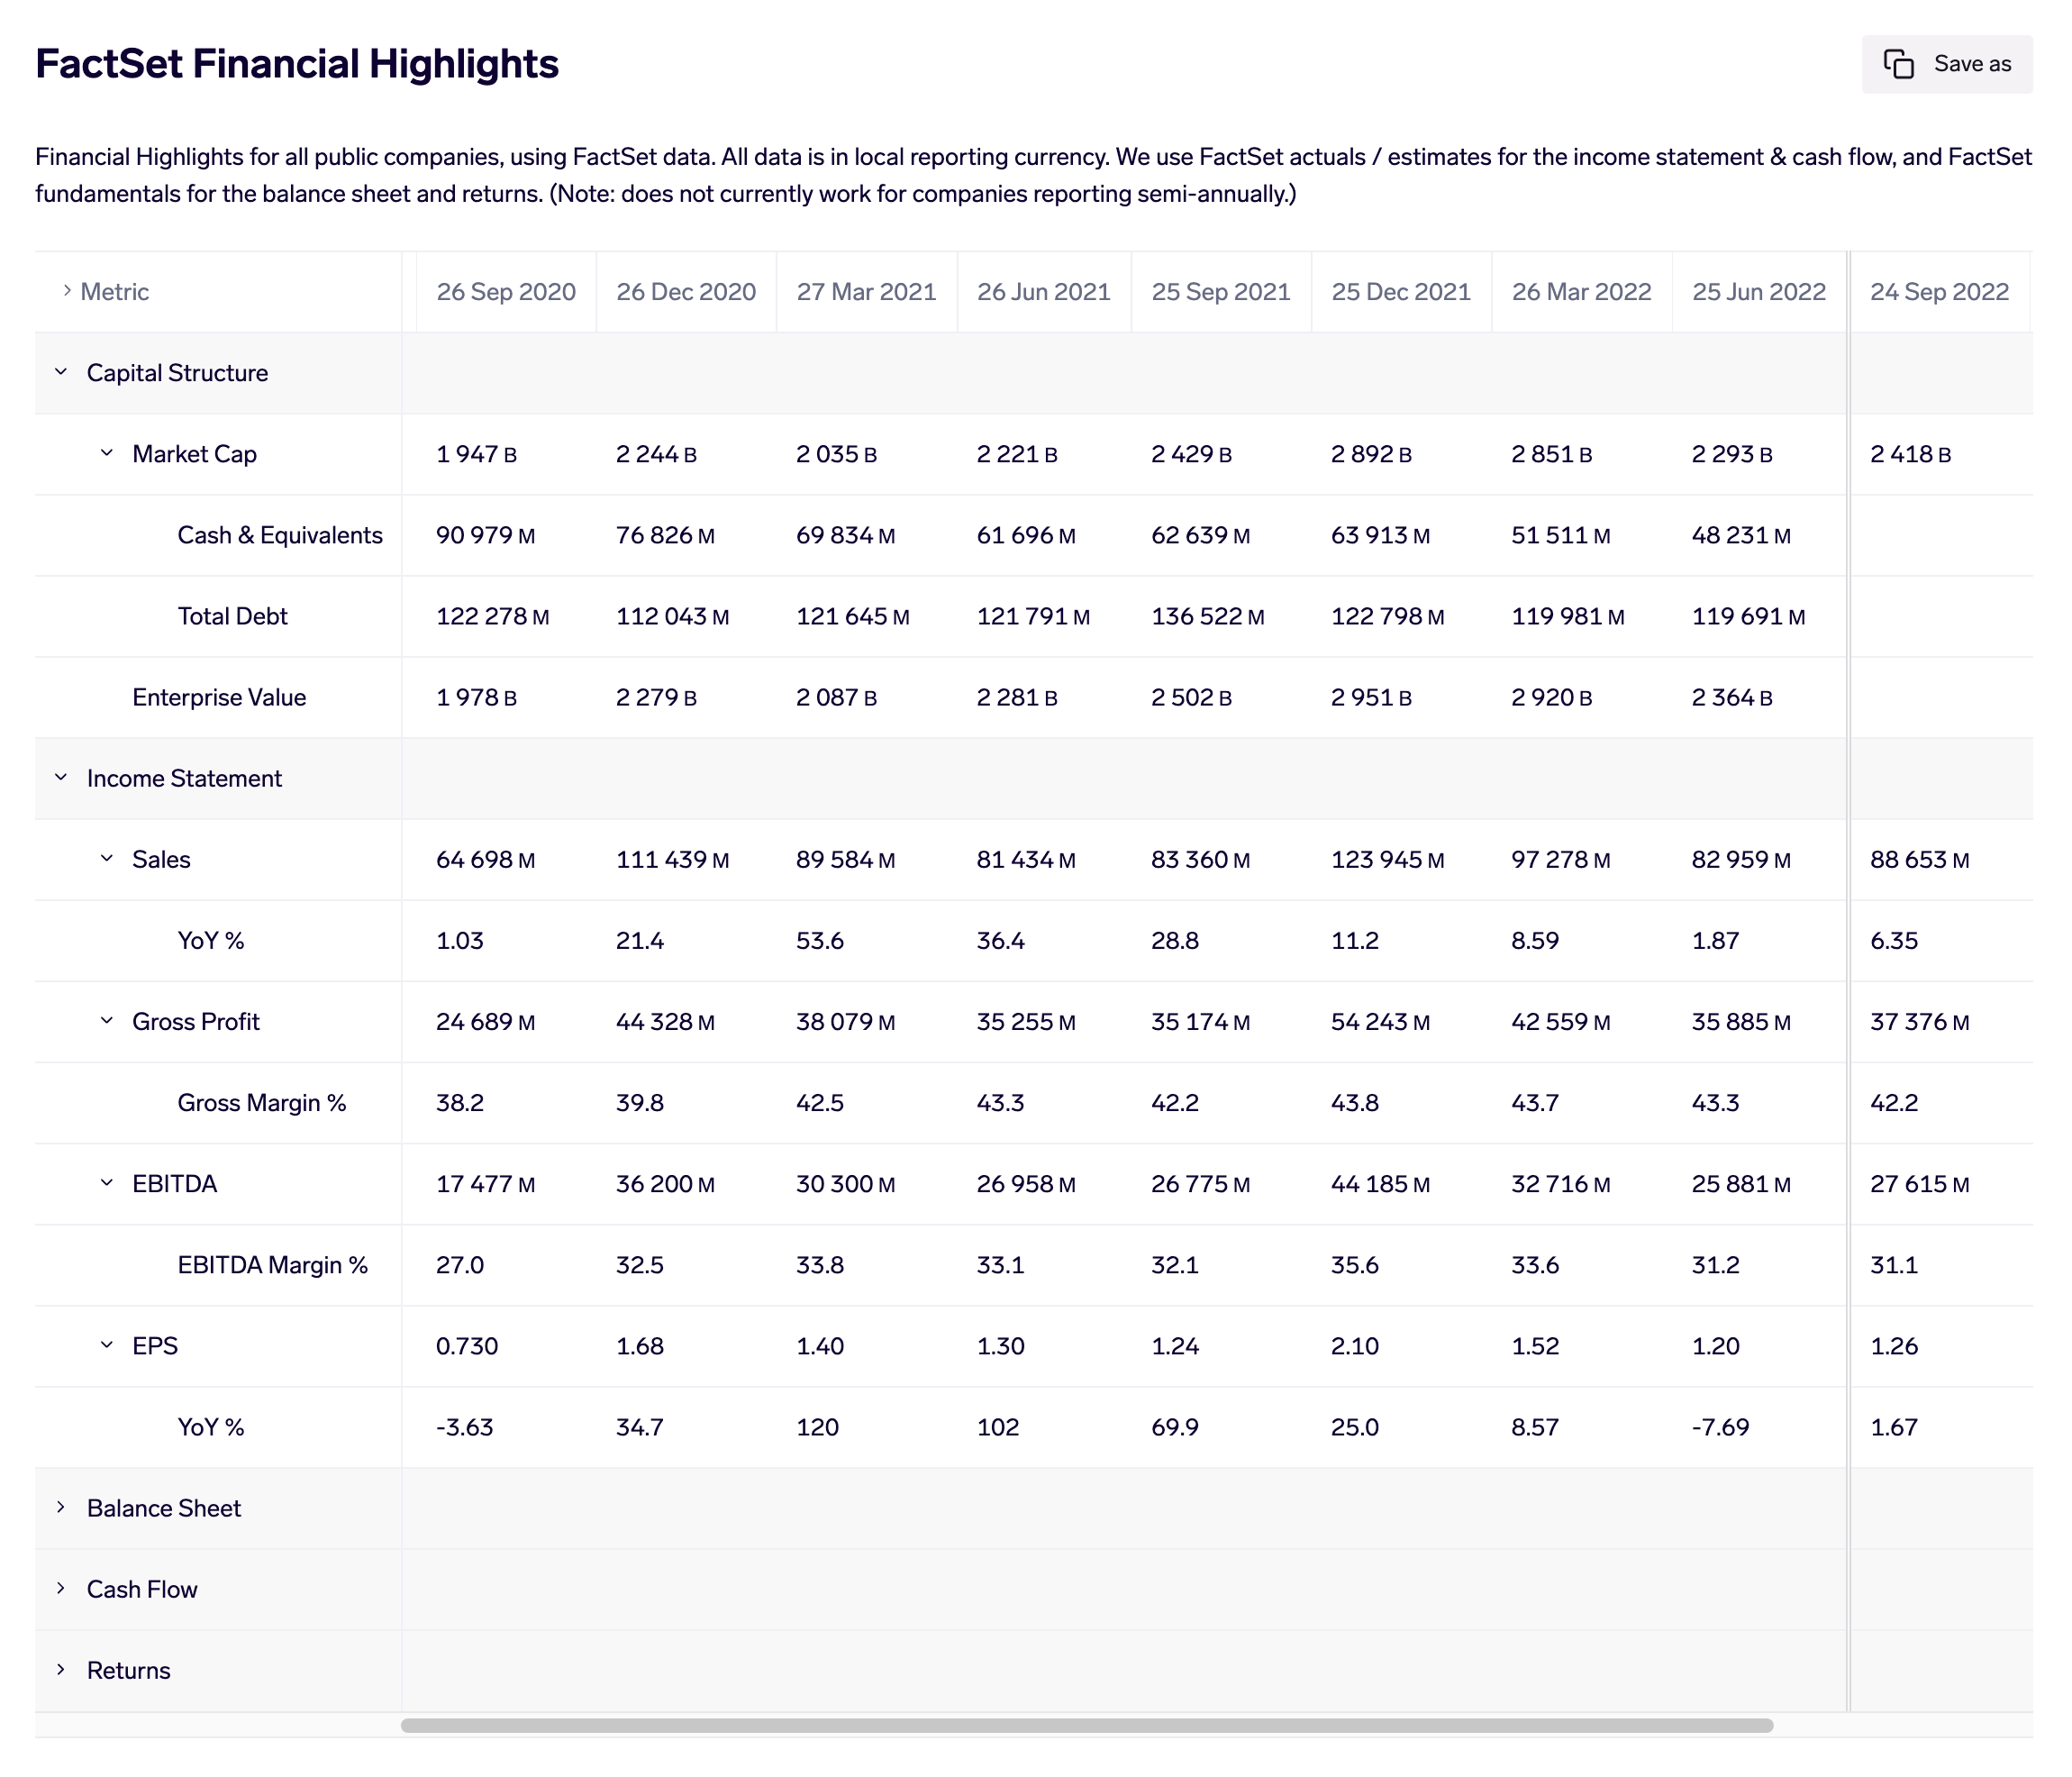
Financial model based on FactSet data, available to all Exabel users
A financial model may be defined on a single company, allowing the use of custom, company-specific KPIs and signals; or may be defined on many companies at once, serving as a generic model as in the FactSet example above.
Understanding Financial Models
Each column corresponds to a fiscal period for the company. These are company-specific and will change automatically, depending on the company being viewed. Future periods are demarcated by a thick vertical line - this is based on FactSet data about which periods have been reported by the company.
Each row in a financial model corresponds to a derived signal. Each row may have multiple child rows that might represent another KPI or signal that is related to the parent row - for example, a child row might represent the YoY change of the parent row. Alternatively, you might use child rows to map one or more alternative data signals that are a proxy for the parent row, as in the example below:
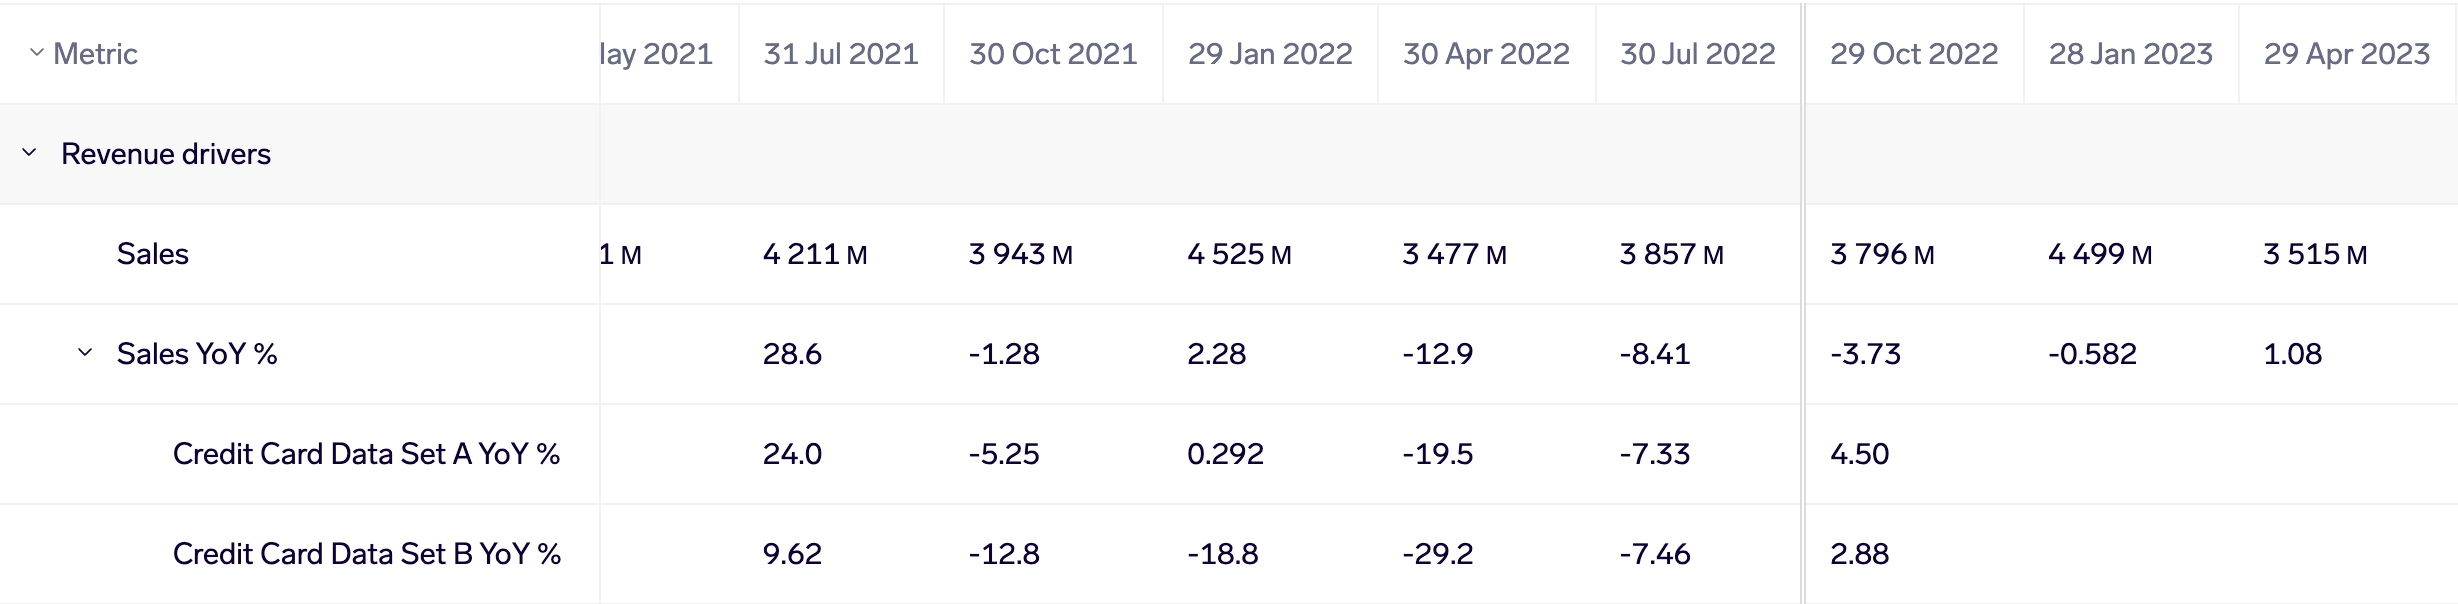
Mapping 2 credit card signals to a financial KPI (sales YoY %)
Each row may optionally use a second derived signal for the future period values. For example, you might use an actual sales signal for the historic periods, and a consensus sales estimate signal for future periods. If only one signal is specified, that signal will be used for both historic & future periods. To learn more, see Configuring Financial Models.
Rows may be grouped into sections to organize different groups of KPIs.
Current limitationsColumns are restricted to being fiscal quarters, which means that they do not work on companies that report semi-annually. We are planning to address this in a future update. In future, we also plan to allow you to use any other custom calendar of your choice - e.g. monthly or yearly.
Rows may not use signals that produce >1 time series. These will produce an error if used in a financial model row.
Navigating to a Financial Model
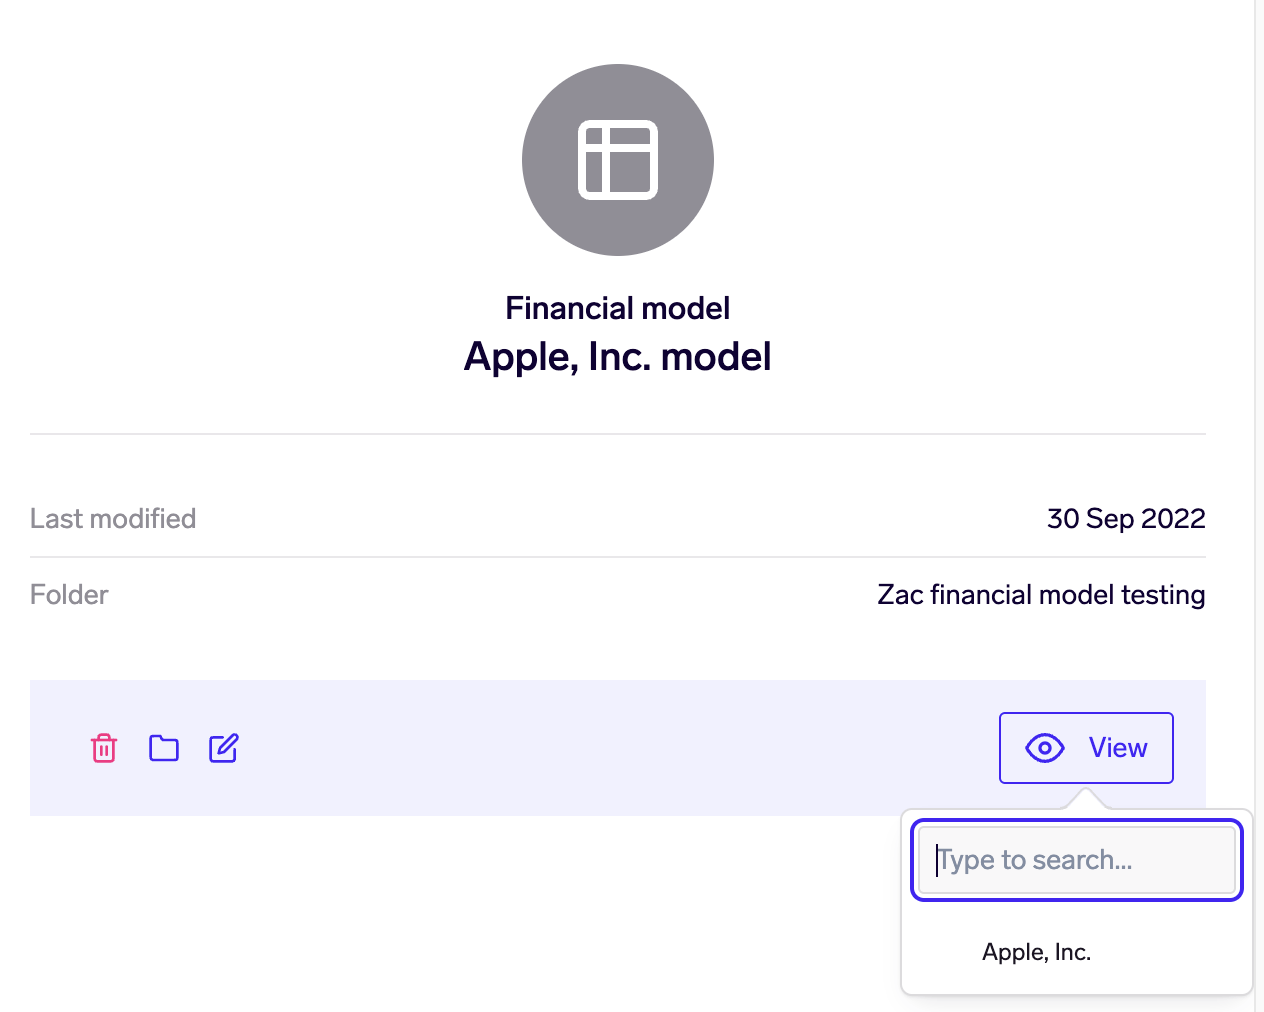
You may navigate to a financial model from your Library by clicking on it and clicking "View" to view the financial model for a given company.
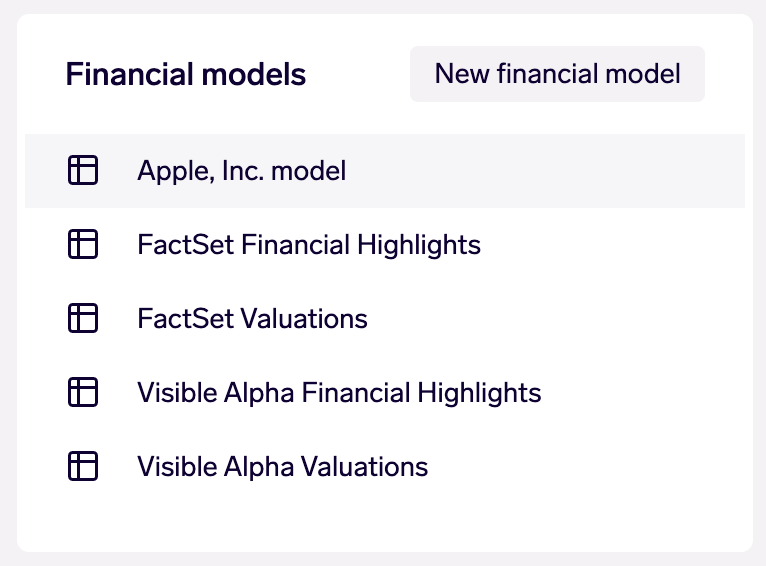
Alternatively, you may use the company search in the Exabel menubar to find and go to a company page. From there, the left-hand panel shows the list of available financial models for that company.
Organizing & Sharing Financial Models
Financial models are organized and shared via the Library.
Each financial model belongs to a Library folder, and may be moved between folders. New financial models are automatically created in your own personal folder.
If a financial model is moved into a shared folder, all users with access to that shared folder will be able to view it. However, users must have write access to that folder, and therefore write access to the financial model, in order to view and edit it. To learn more, see Configuring Financial Models.
Updated 2 months ago