Alert Triggers
Choose a trigger method that best suits your data
There are 3 types of alert triggers, each suited to different alerting scenarios:
- Numeric trigger: general-purpose trigger to alert if your signal is above and/or below a set threshold.
- Change trigger: detect sequential change within a set time horizon. Works well for non-seasonal signals like market share.
- Outlier trigger: "smart" alert for outliers / anomalies where your signal exceeds a set confidence range. Best for medium-frequency data like monthly or quarterly sales.
We recommend testing the triggers in the alert preview, which lets you examine what alerts would have been triggered on historical data.
Numeric Trigger
The numeric trigger is the simplest trigger, which checks if the latest data point is above and/or below a set threshold.
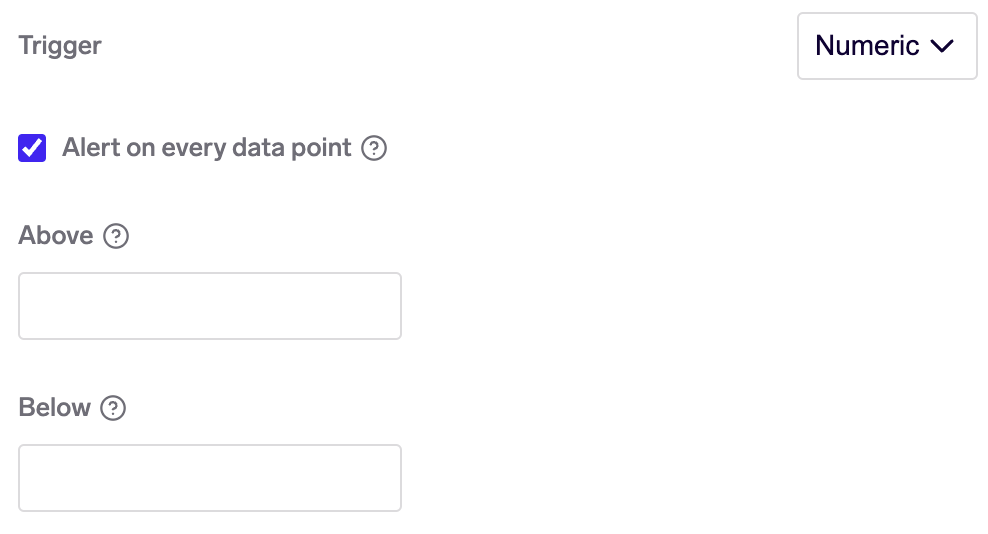
Numeric trigger
You may choose to be alerted on "every data point", which triggers a new alert event for each data point that meets the trigger criteria. If you turn this off, then the alert remains "active" as long as new data points continue to meet the criteria.
Alerting on every data point - exampleLet's say your signal produces this time series for a company:
- 1 Jan 2022: 11
- 2 Jan 2022: 11
- 3 Jan 2022: 9
- 4 Jan 2022: 11
If you "alert on every data point" and set an "Above" threshold of 10, you will receive 3 alert events for the 1, 2 and 4 Jan 2022 data points.
If you disable alerting on every data point and set the same "Above" threshold, you will only receive 2 alert events: 1-2 Jan 2022 and 4 Jan 2022. If you have set up email notifications, you will only be notified once about the 1-2 Jan 2022 event.
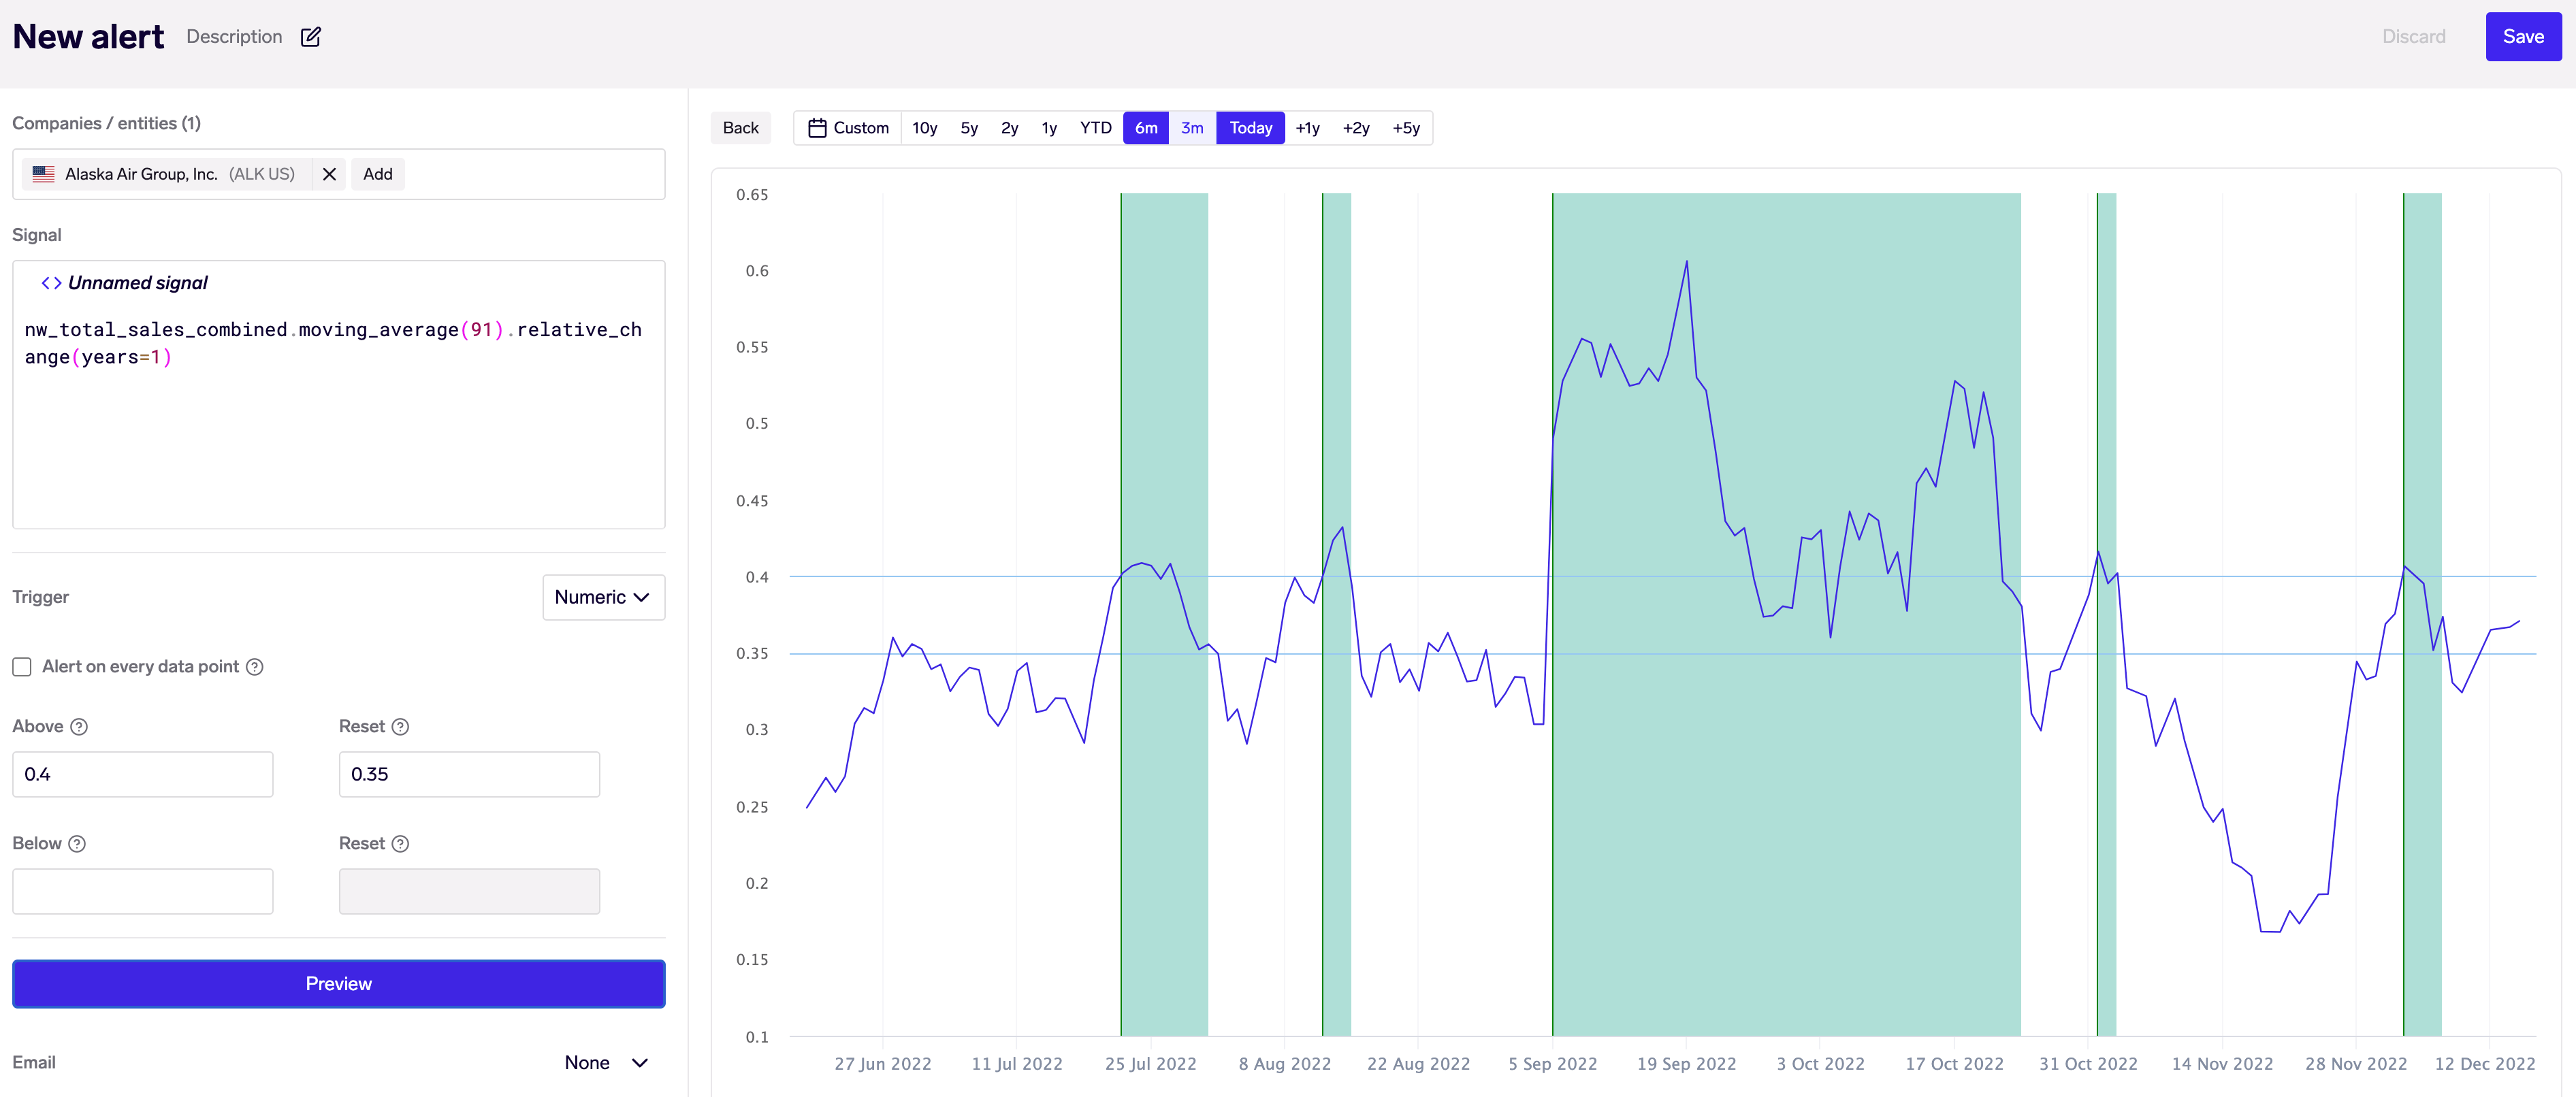
If you choose not to alert on every data point, you may also set additional "reset" thresholds. These help to reduce alert noise from volatile signals that may oscillate around your numeric threshold.
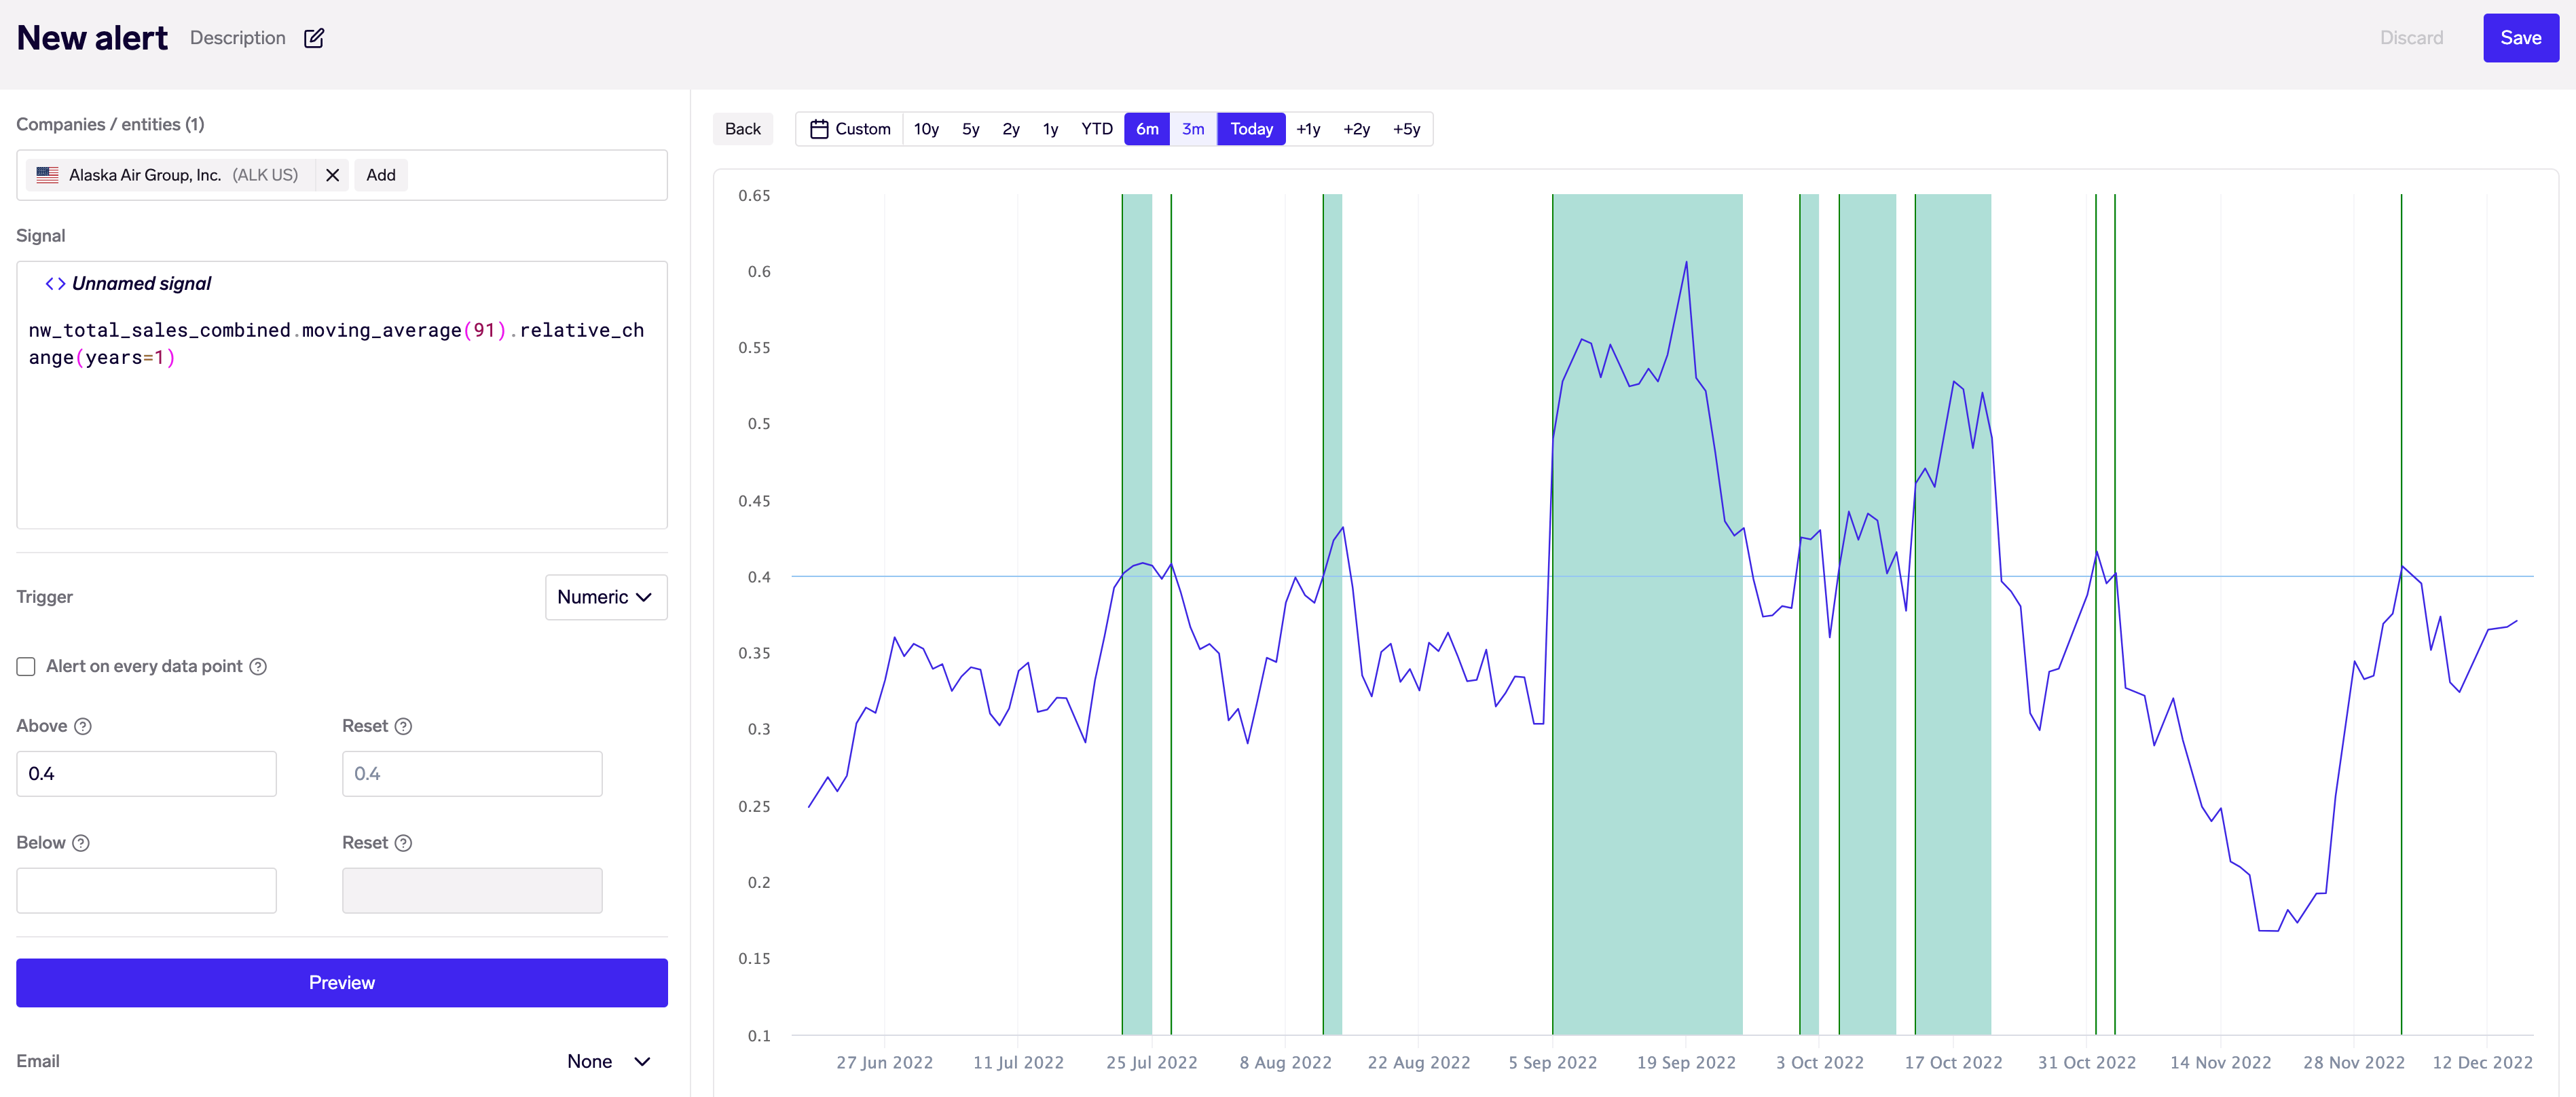
Reset thresholds - exampleFor example, the following alert is set up on a credit card signal that has a 91-day moving average + YoY transform applied. As a user, you care about when this growth signal exceeds a set threshold, but do not want too much noise from growth dipping slightly below the level and then exceeding it again.
A numeric trigger is set to fire above 0.4 (40%), which results in 10 alert events being generated in a 6 month period, because the signal frequently oscillates around the 0.4 level.
If a reset threshold of 0.35 (35%) is now added, the trigger only resets when the signal dips below the level of 0.35. During the short periods where the signal dips below 0.4 but stays above 0.35, the alert event continues to stay active (see the larger green shaded areas). On the same data, only 5 alert events are now generated, vs 10 previously.
Change Trigger
The change trigger looks for sequential change in your signal, on an absolute and/or relative (percentage) basis.
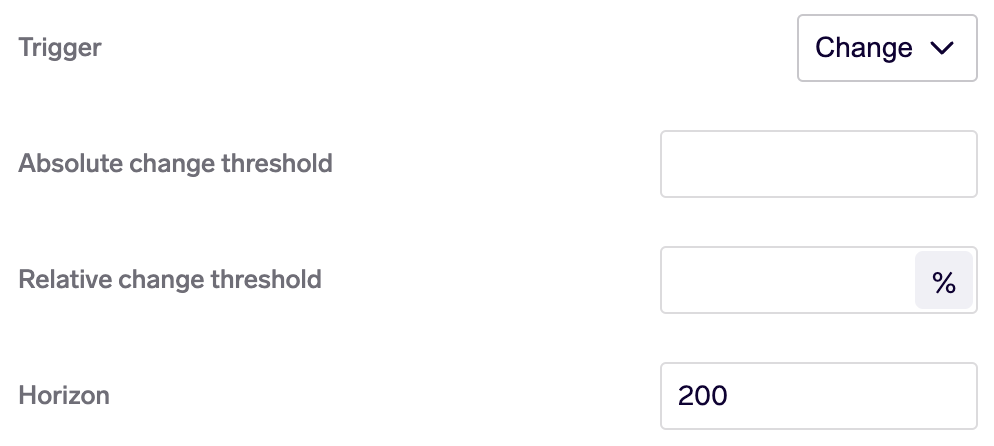
Change trigger
You may set thresholds for absolute and/or relative change, and a time horizon in days. For each new data point, the trigger will look at all historical data points within the set horizon.
For instance, the following alert is setup to monitor market share between Uber & Lyft, as measured by number of trips taken, with a trigger at a 0.10 (10% point) change in market share, over any trailing 200-day period. Alert events are fired for Lyft taking market share from Uber in the early-2020 period.
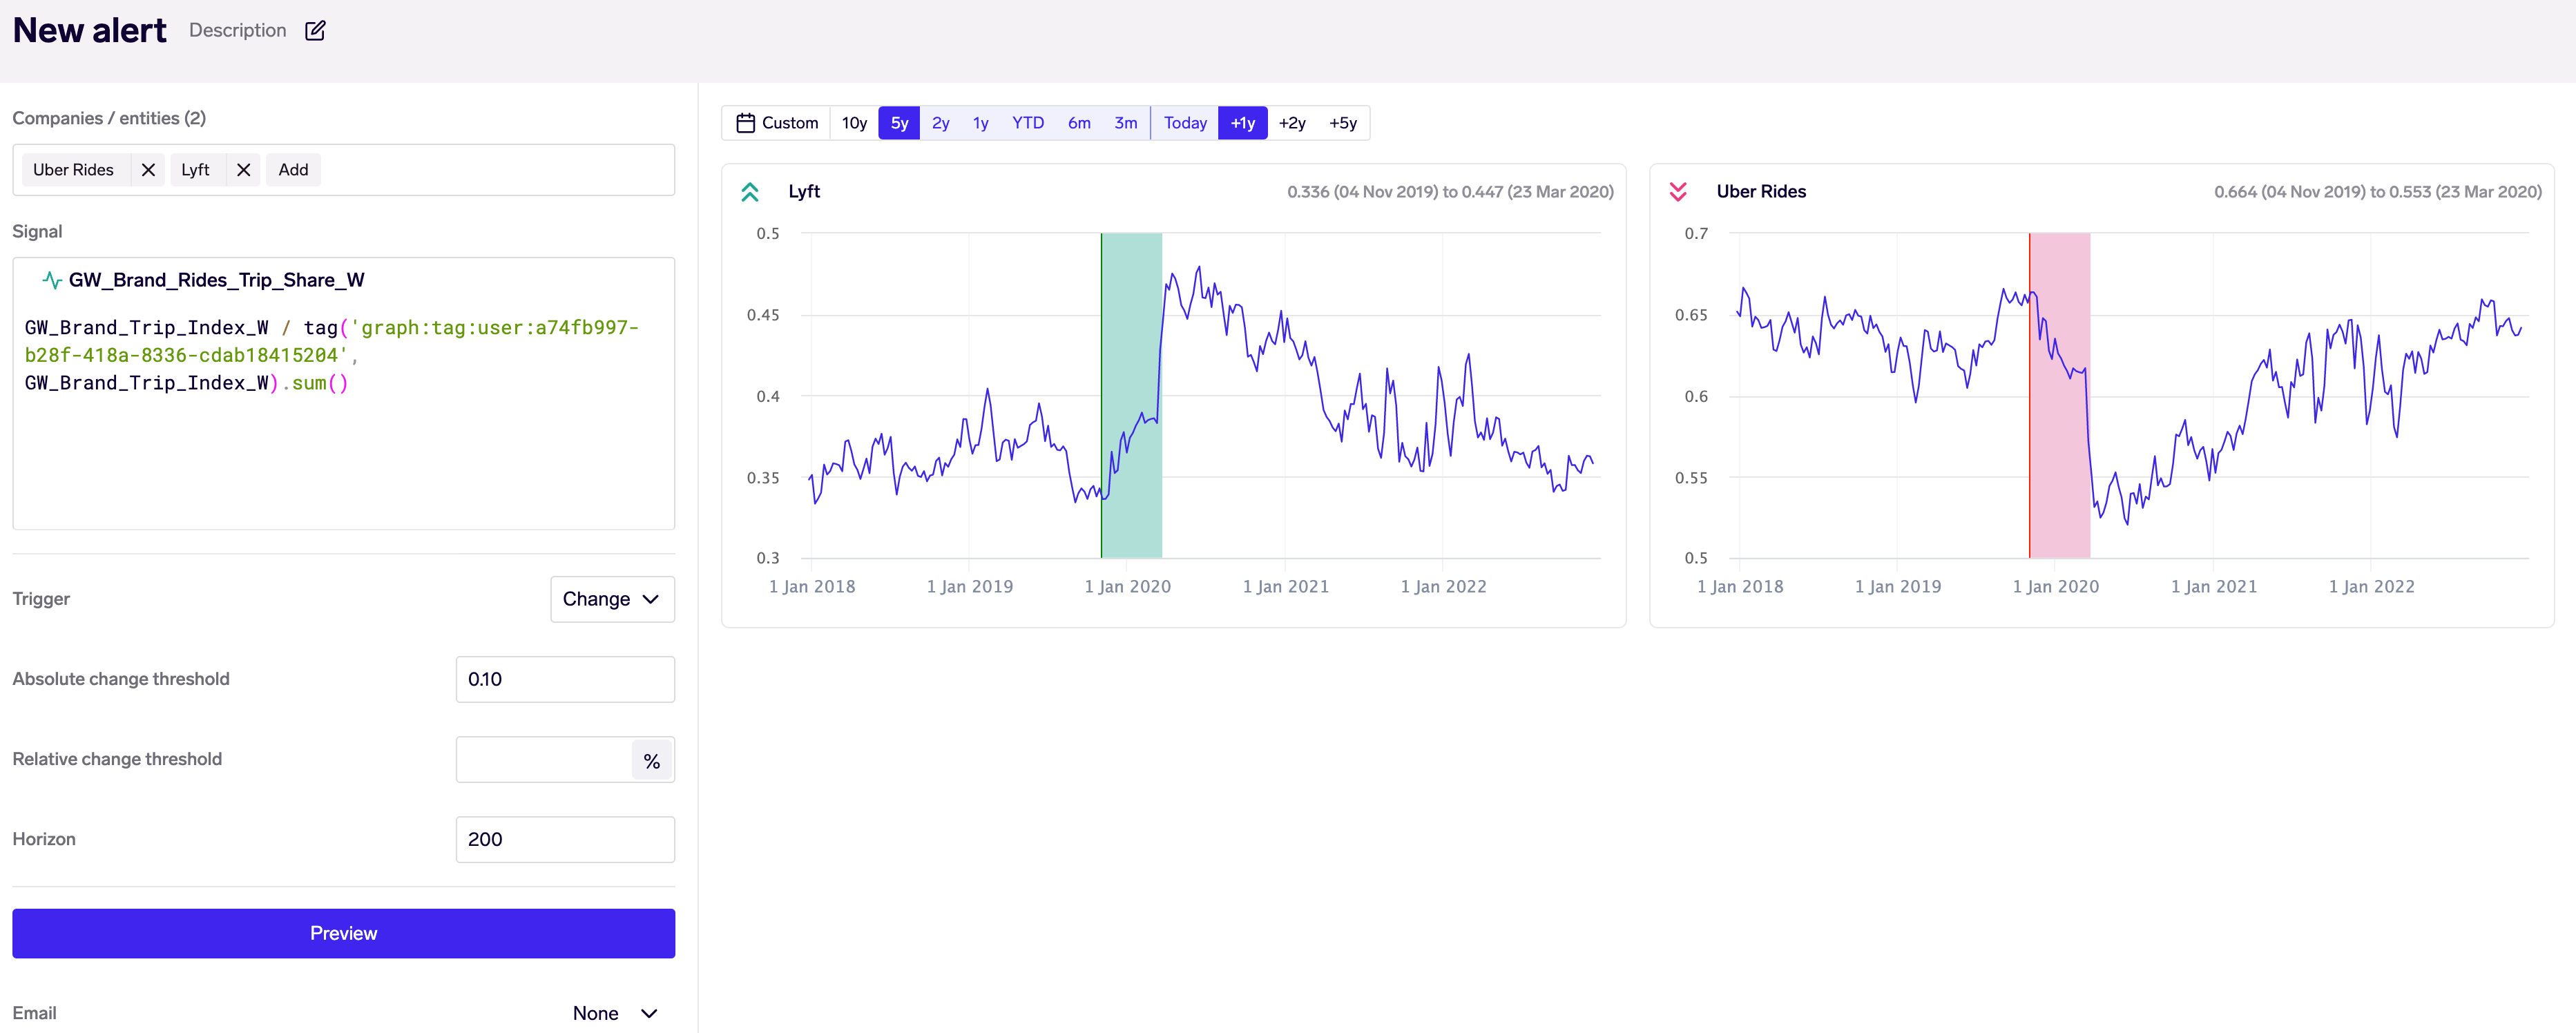
Change trigger to monitor market share
Note that while a horizon of 200 days was set, the alerted change was over a shorter period of ~150 days. This is because the change trigger looks for changes from any point within the horizon.
Also note that as the signal here already produces market share in percentage points, we specify an absolute change threshold, rather than relative change.
Outlier Trigger
The outlier trigger is a smart trigger that looks for anomalies in a signal, without requiring you to set a fixed numeric threshold.
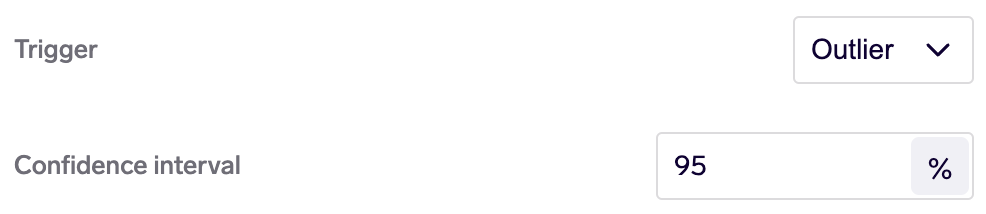
To set up an outlier trigger, specify a confidence interval (we recommend starting with 90% or 95%). The trigger analyzes the signal's historical trend, seasonality & volatility to determine a confidence band of likely values for each new data point; this confidence band is calculated separately for each company/entity. Data points that fall outside this confidence band will then trigger the alert.
Outlier trigger
This example shows an alert on a medical purchase order data signal, which provides sales estimates on a monthly frequency. An outlier trigger is configured with a 95% confidence interval, and the preview shows the historical confidence bands shaded in blue, and detected anomalies (alert events) in red and green markers.
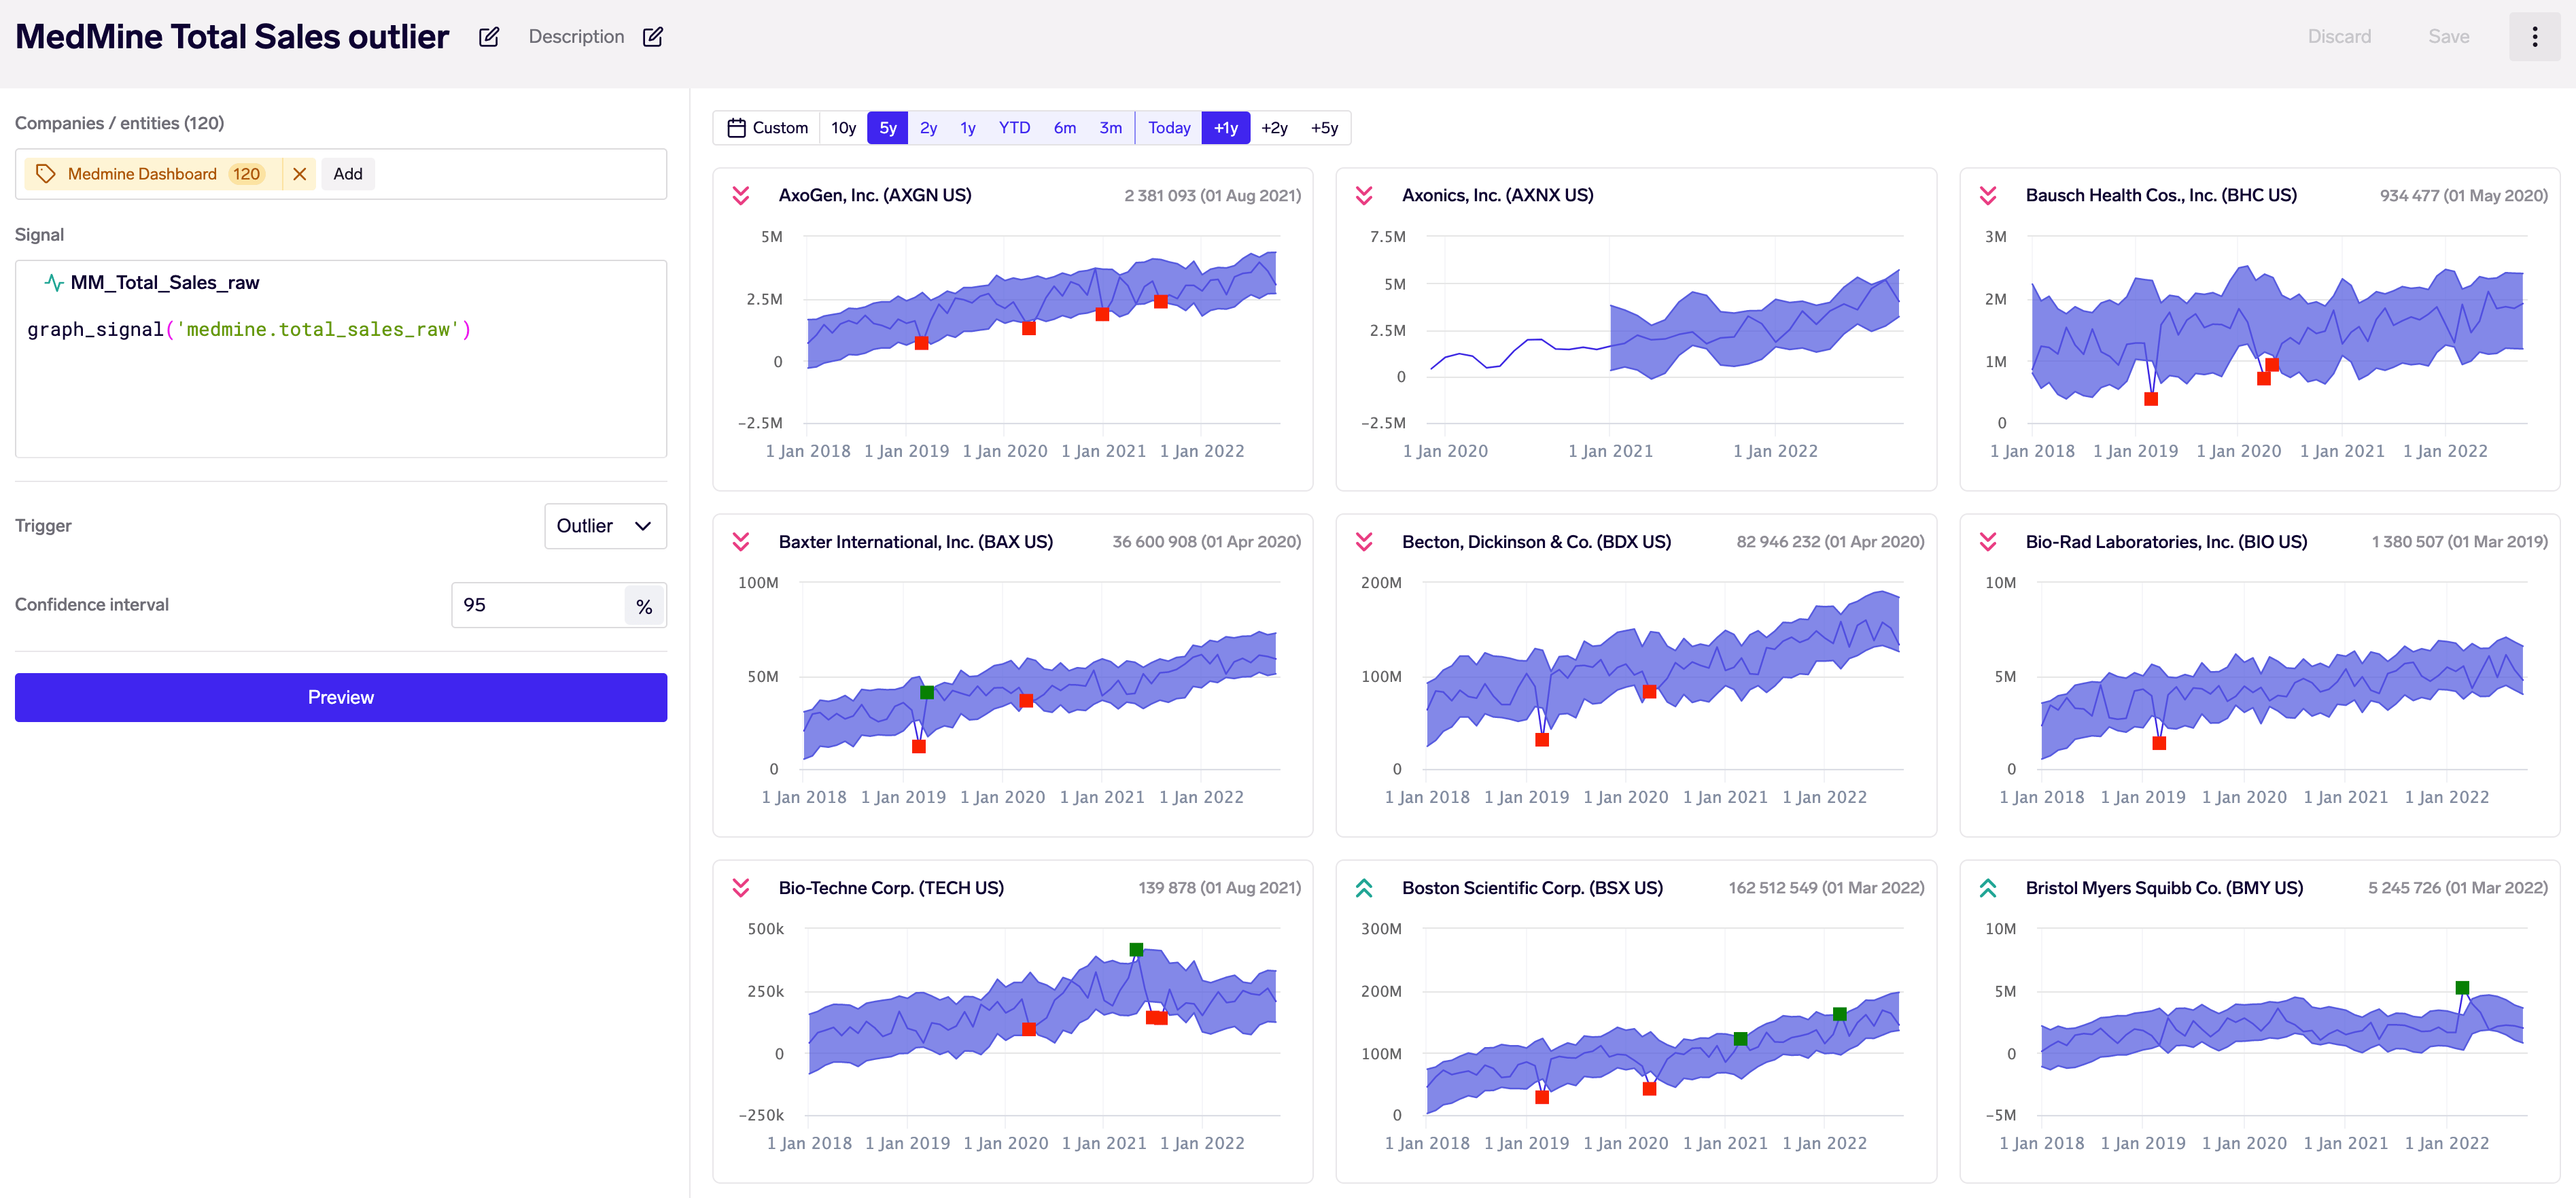
Outlier alert to monitor anomalies in monthly sales data
Note that the outlier trigger will alert on every data point - a new alert event will be generated for every data point that falls outside the confidence band.
Outlier trigger methodologyThe outlier trigger works by running a univariate forecast model on the alert signal for each company/entity in the alert. This extracts the historical trend, seasonality and variance of the signal, which is then used to forecast upper & lower confidence bands for each data point on a walk-forward basis.
We then compare each data point with the confidence band and trigger the alert if it falls outside the confidence band.
Updated 2 months ago