Dashboards
Visualize data for many companies / entities at once
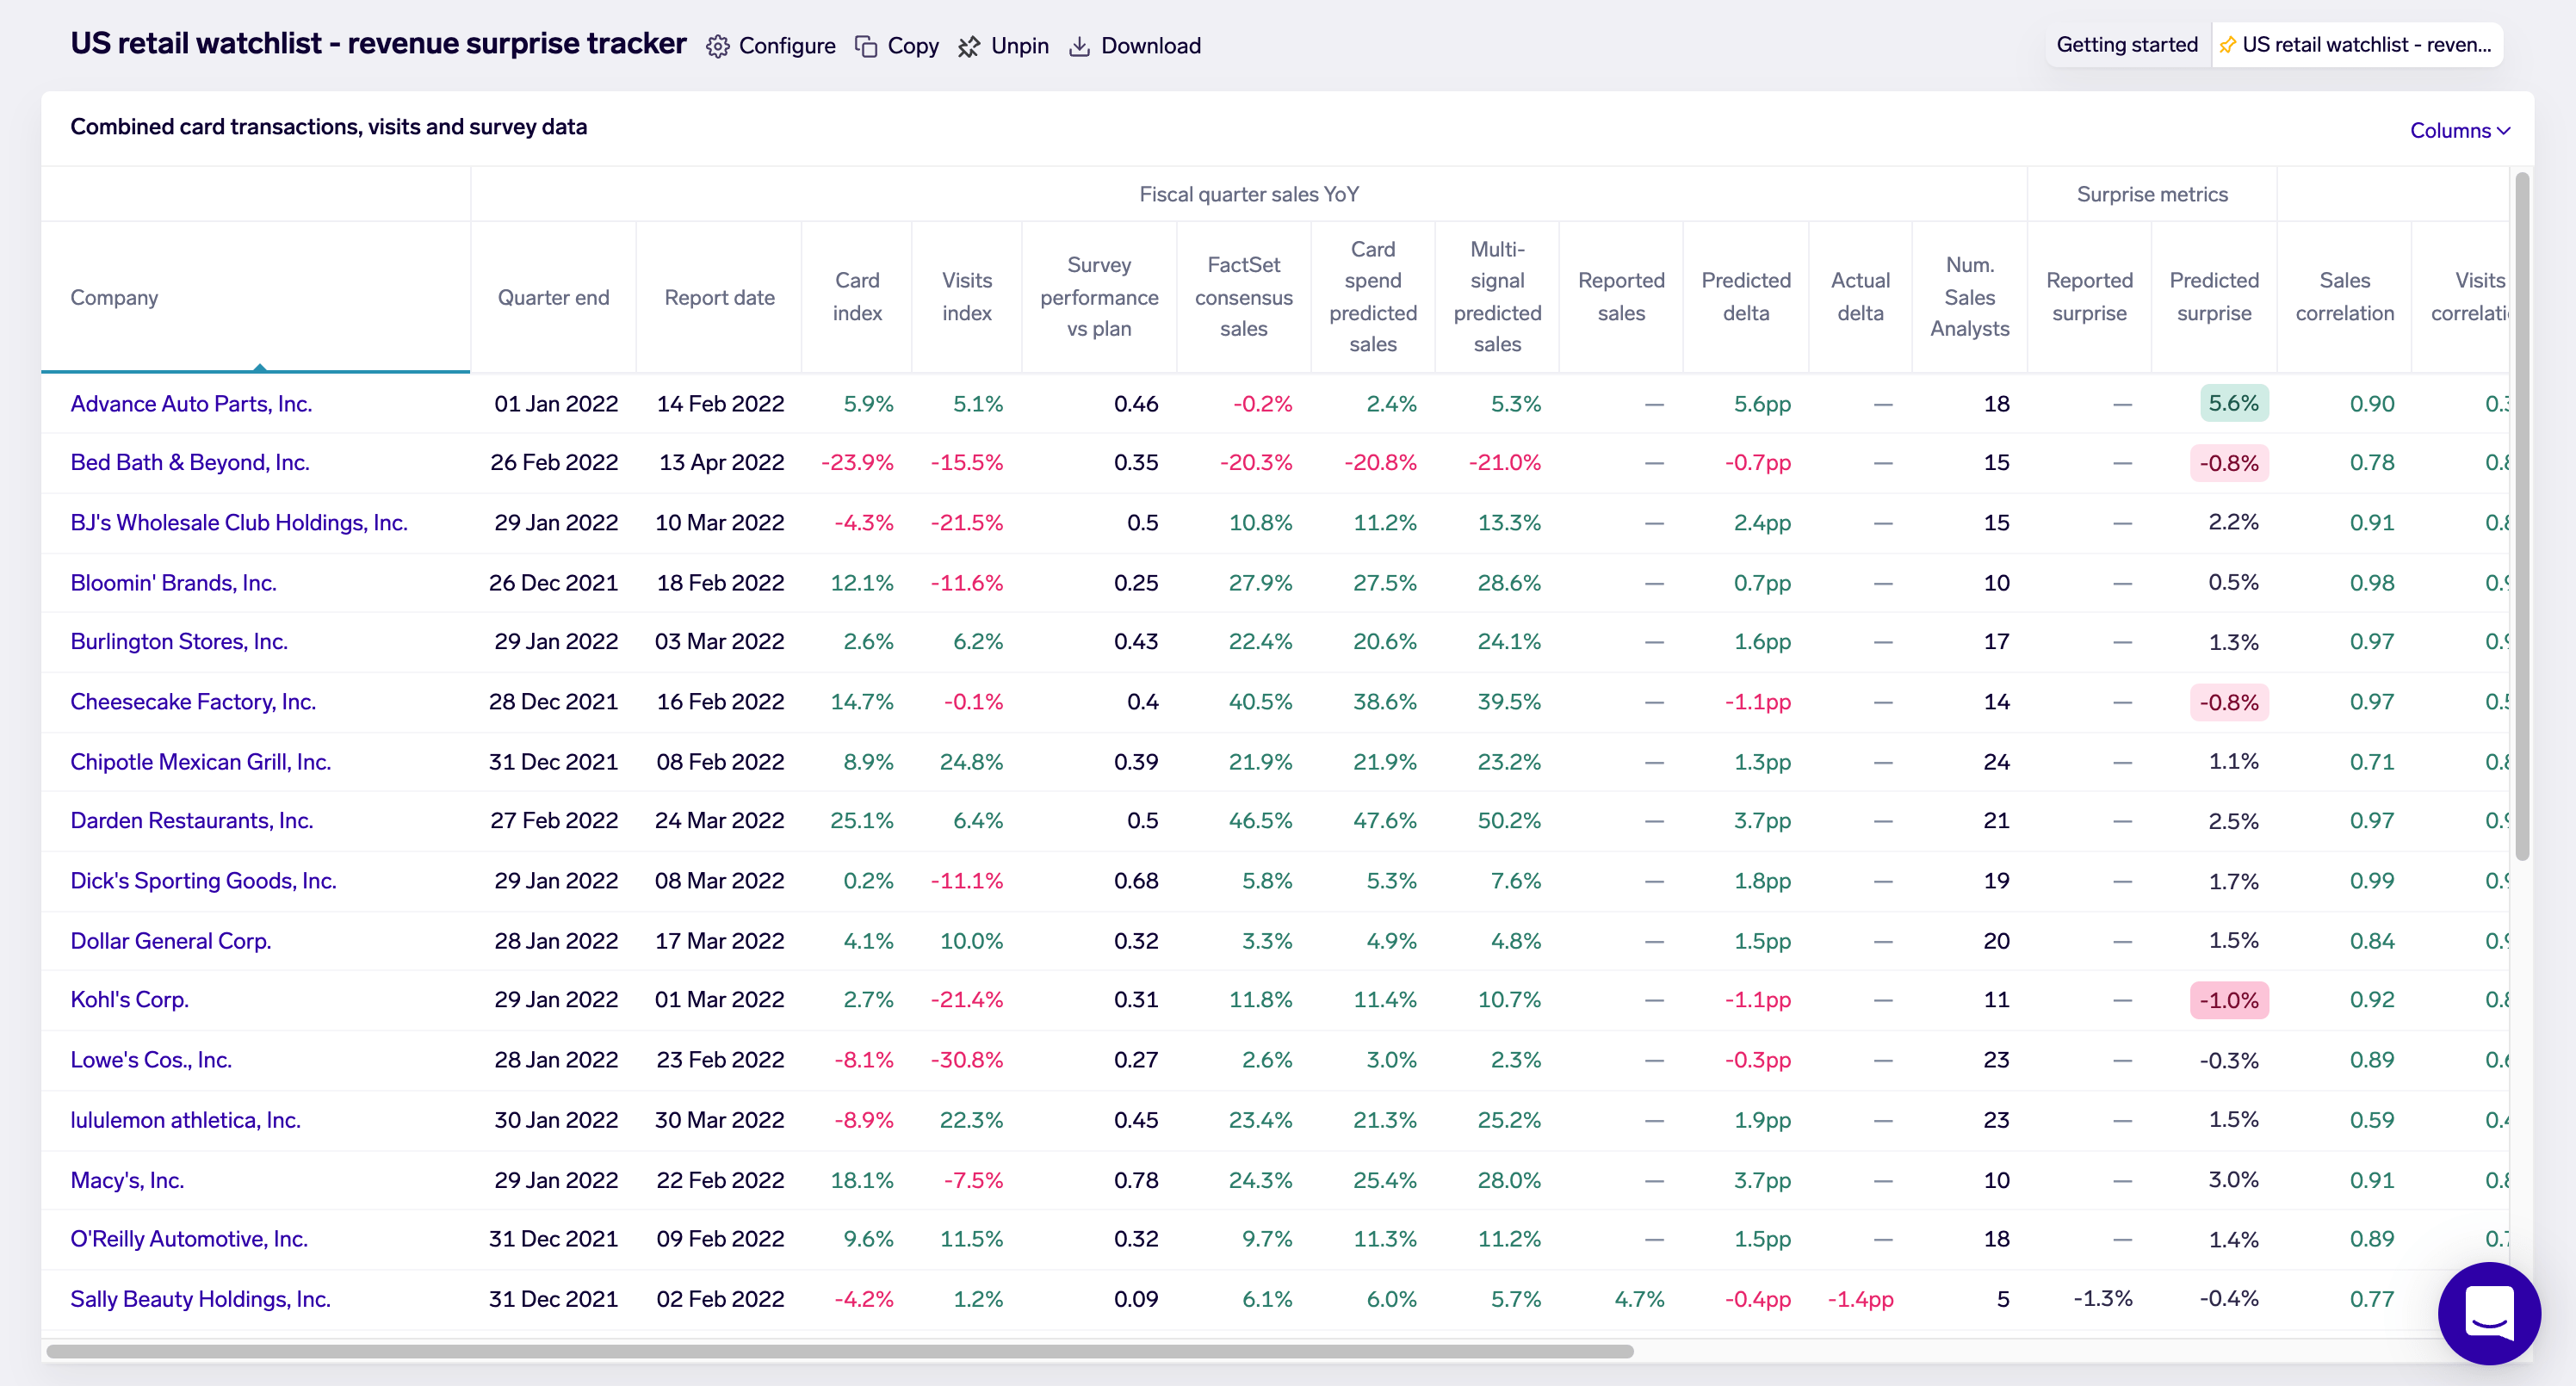
Dashboards help you visualize data from multiple signals, across many companies / entities in a single table view.

Dashboards are laid out with signals in columns, and companies / entities in rows
Dashboards are configurable to display any derived signal, and for any tag of companies or entities.
Using Dashboards
To find a dashboard, the Exabel "Dashboards" menu bar provides a list of dashboards, with the most recent dashboards at the top; you may also click "Load Dashboard" which will help you browse and search your Library for dashboards.
Dashboards are highly interactive:
- Columns (signals): mouse-over to see a description; click to sort and filter based on column values
- Rows (companies / entities): click to drill-down into that company / entity - note the dashboard must be configured to point to an existing drill-down
- Cell values: click to open a pop-up chart showing the time series data underlying that value - this is the time series of that column's signal, for that row's company / entity
Exporting Dashboards
To export a dashboard, click on the Download button next to the dashboard's name at the top of the screen.
Organizing & Sharing Dashboards
Dashboards are organized and shared via the Library.
Each dashboard is stored in a Library folder, and may be moved between folders. New dashboards are automatically created in your own personal folder.
If a dashboard is moved into a shared folder, all users with access to that shared folder will be able to view the dashboard. However, users must have write access to that folder, and therefore write access to the dashboard, in order to view and edit the dashboard configuration (for more, see Configuring Dashboards).
Updated 5 months ago