Results
Review KPI analysis results across all mappings in a collection
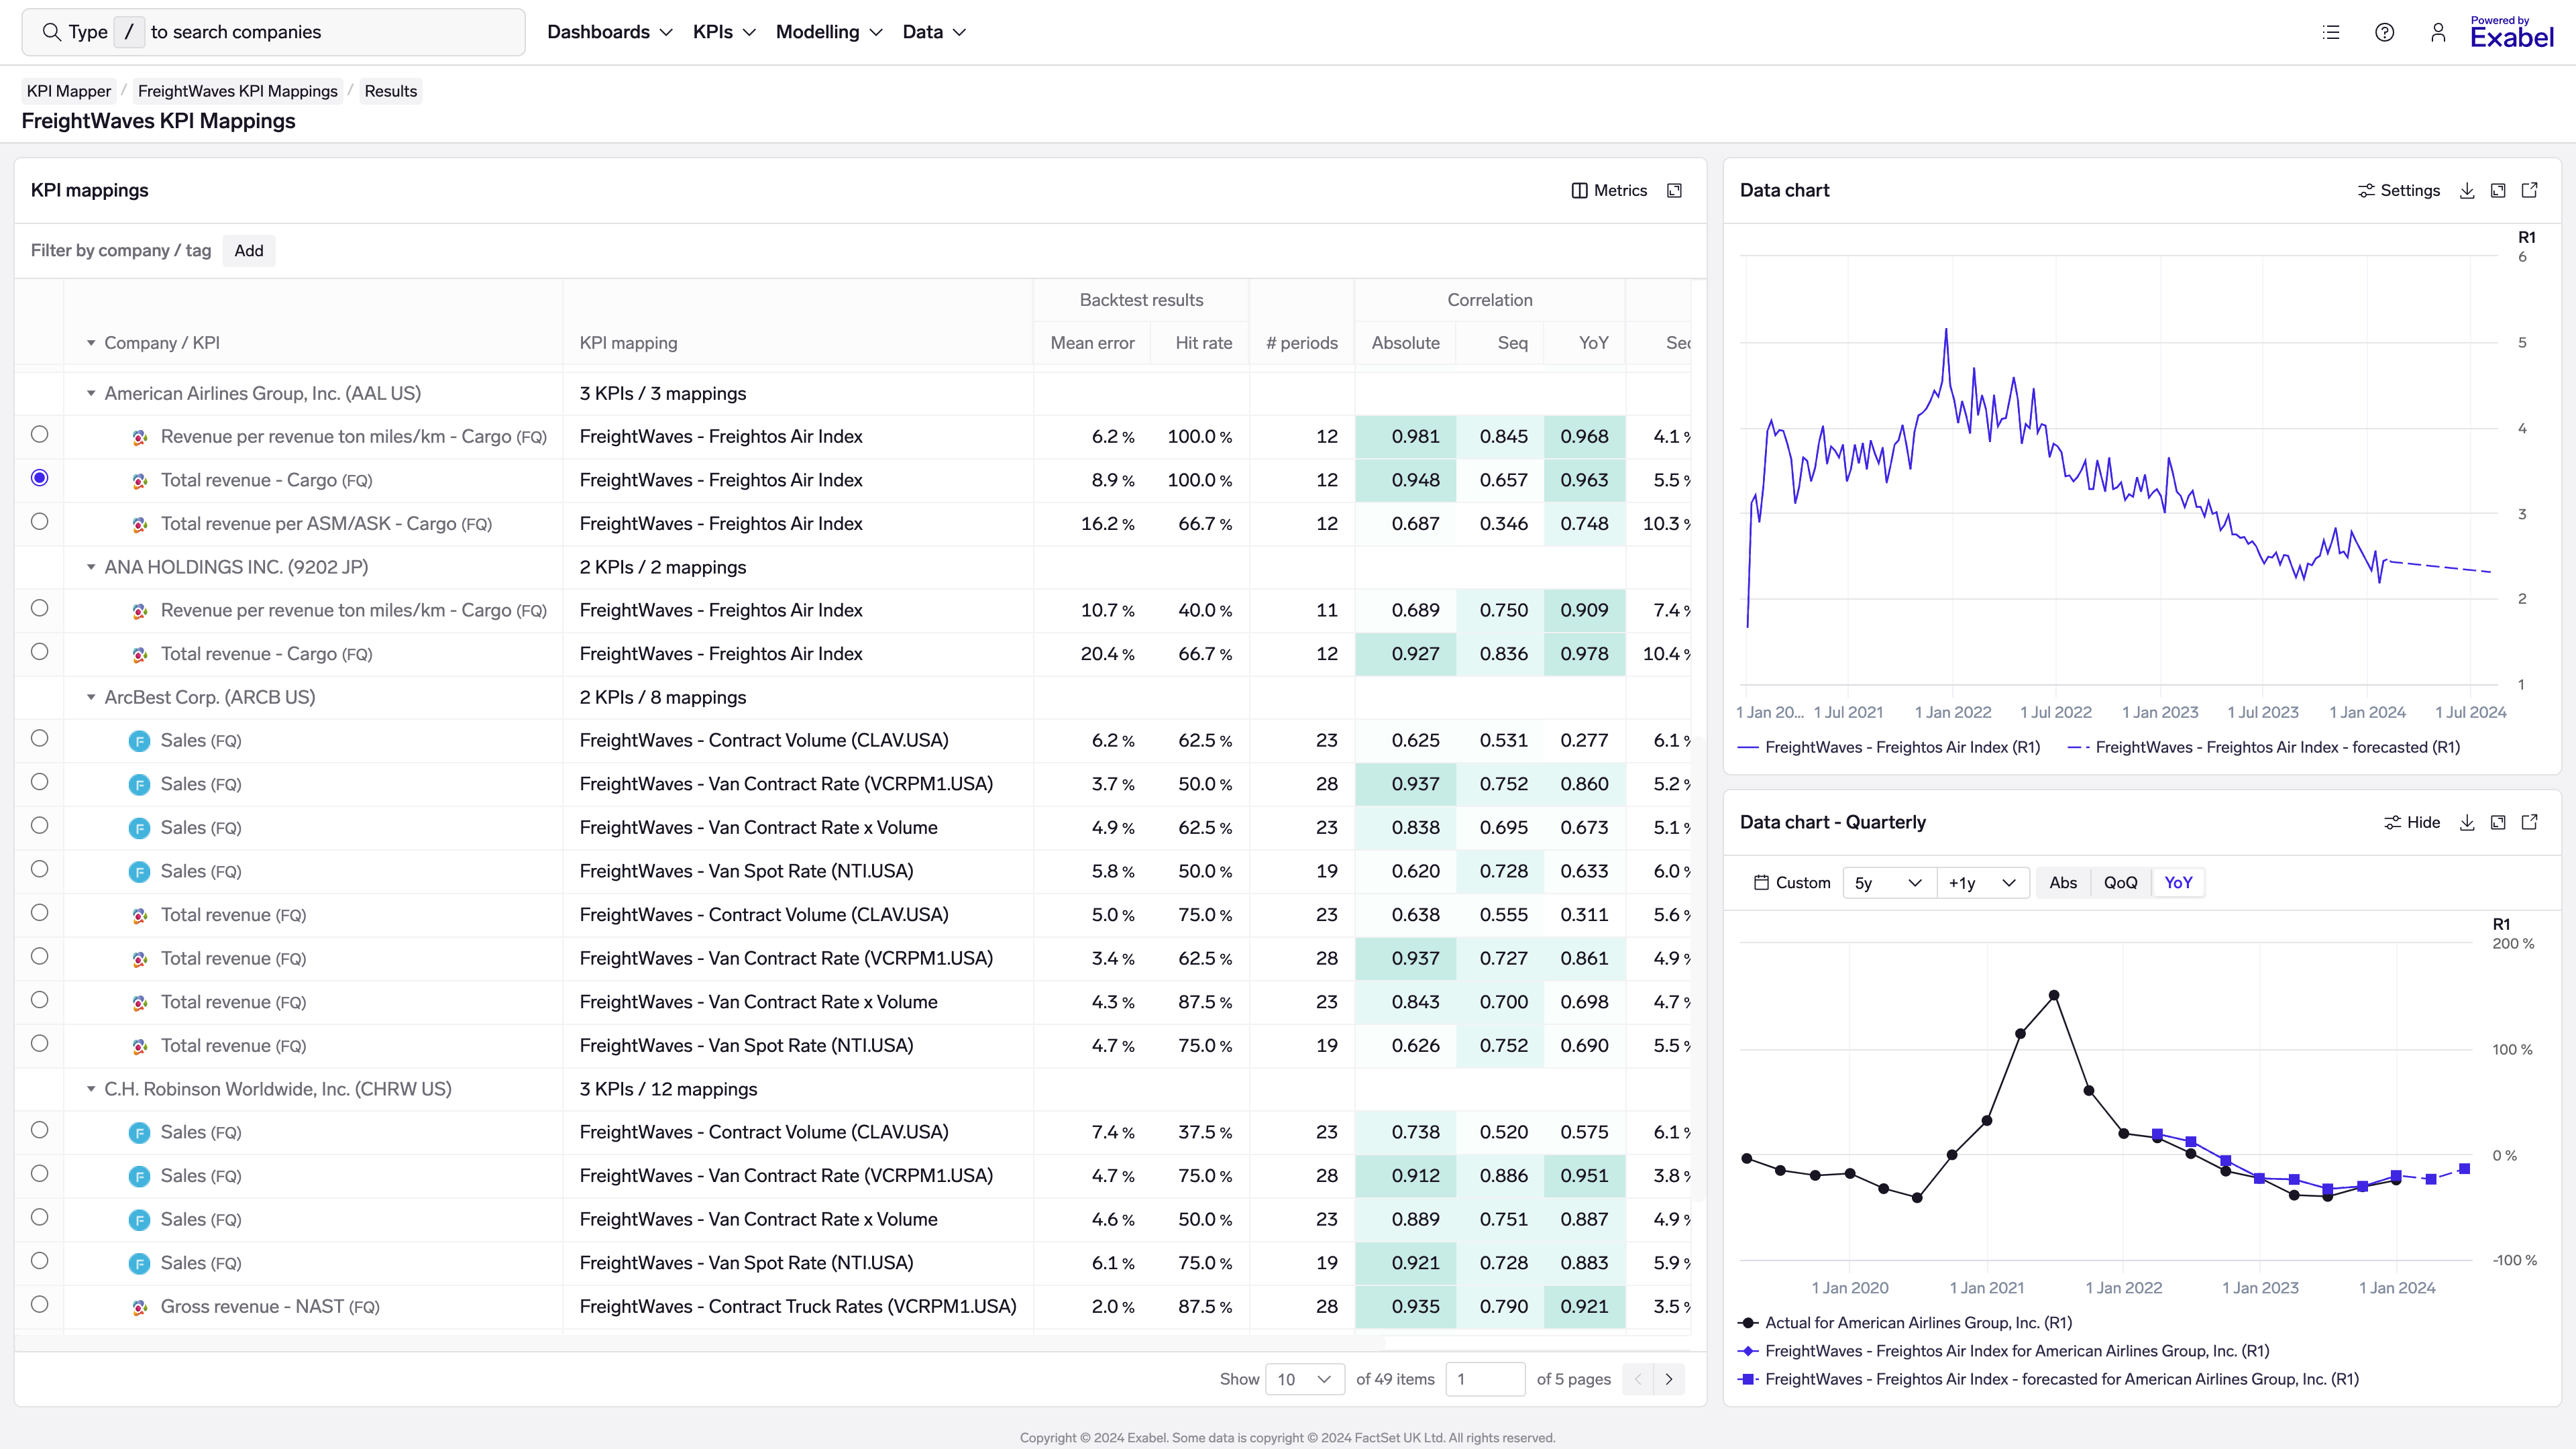
The results view shows you KPI analysis results for all companies in a KPI mapping collection.
Reviewing results across all companies in a vendor KPI mapping collection
Each row in the table shows an individual KPI mapping. If you have many mappings for the same KPI (as per the example above), they will all appear in the table, allowing you to understand which mappings are stronger.
The table shows backtest results and evaluation metrics like correlation - these are identical to those in the KPI Analyzer Mappings view (click here to learn more).
You may also filter for specific companies' results by specifying them in the filter bar above the table.
Selecting a row in the table allows you to view the underlying data for that KPI mapping. As you move your mouse over companies & KPIs in the table, you'll also see a floating menu popup with links to the KPI Analyzer, allowing you to deep-dive into that company or KPI if you wish.
Product roadmap: sorting / filteringWe plan to allow sorting & filtering on the evaluation metrics in the future.
Updated 2 months ago