KPI Analyzer
Map, Model and Monitor company KPIs with alternative data
Exabel's KPI Analyzer allows you to identify the signals that best track the KPIs you care about, and train models that combine these to make accurate predictions.
To start doing KPI analysis, simply search for a company in the search bar, and click into the KPI Analyzer from its company page.
There are 3 parts to KPI analysis in Exabel
- Monitoring: monitor data and predictions in dashboards to identify inflection points and manage risk around results season
- Mapping (for advanced users): map alternative data to company KPIs, to evaluate and identify the best signals for tracking KPIs
- Modelling (for advanced users): combine KPI mappings from multiple sources to train models that predict KPIs
Exabel curates vendor KPI mappings and models so that you may start monitoring out-of-the-box. In addition, you may use the KPI Analyzer to customize your own mappings & models, and then apply these to the monitoring view.
Monitoring view
The Monitoring view is the initial view when opening the KPI Analyzer, and gives you an overview of all KPIs for a given company, with key information such as the current quarter predictions from your Auto / custom models.
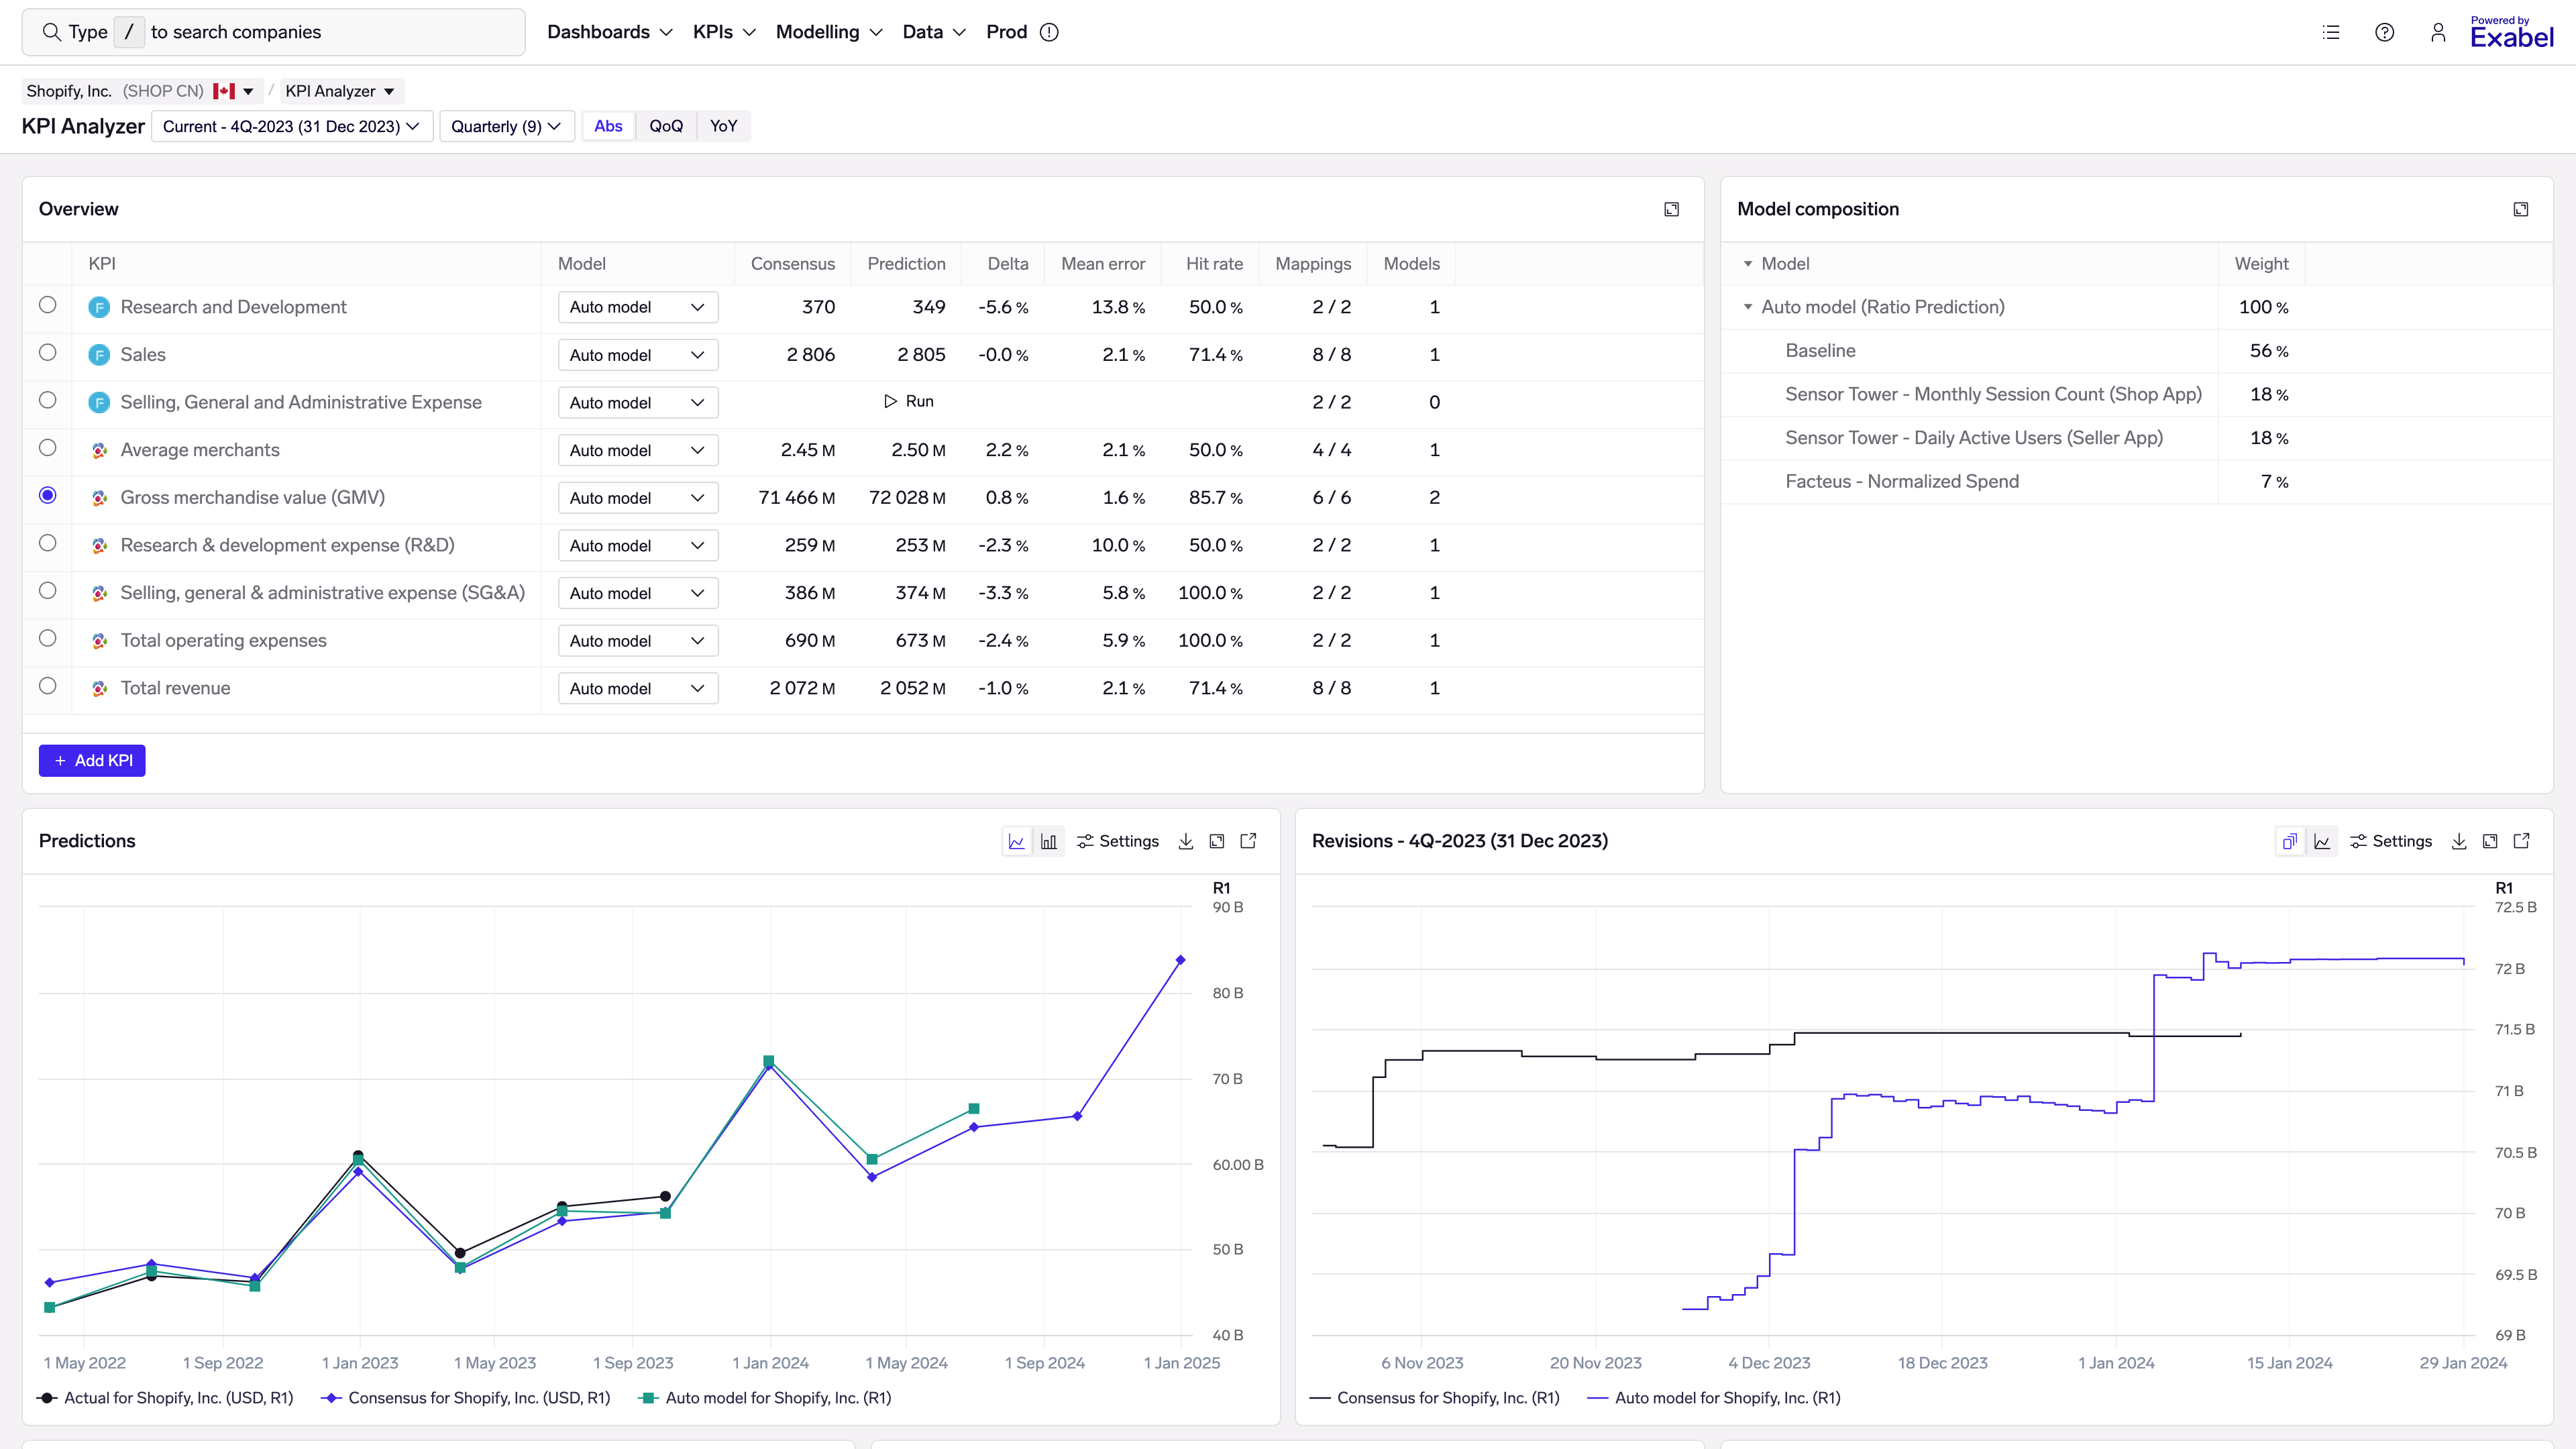
KPI Analyzer Monitoring view
Only KPIs with mappings / models are shownThe Monitoring view will only show KPIs that have curated vendor mappings & models, as well as any KPIs to which you have chosen to add.
For direct Exabel buy-side customers, you will see KPIs that have vendor mappings, even if you are not subscribed. This helps you more easily discover what data might be available on KPIs.
For vendor Insights Platform customers, you will only see KPIs that your subscribed vendor has mapped to. Contact us at [email protected] to learn more about getting access to additional vendors.
From here, you can deep-dive into Mappings or Models by moving your mouse over a KPI and clicking on "Mappings" or Models.
Alternatively, click "Add KPI" to add a new KPI to your view. You'll be taken to the Mappings view, where you'll have to create mappings to this new KPI, in order to start monitoring it.
Mappings view
The Mappings view zooms into 1 specific KPI for a company, showing all available KPI mappings for that KPI, as well as their evaluation metrics (backtest results, correlations, etc).
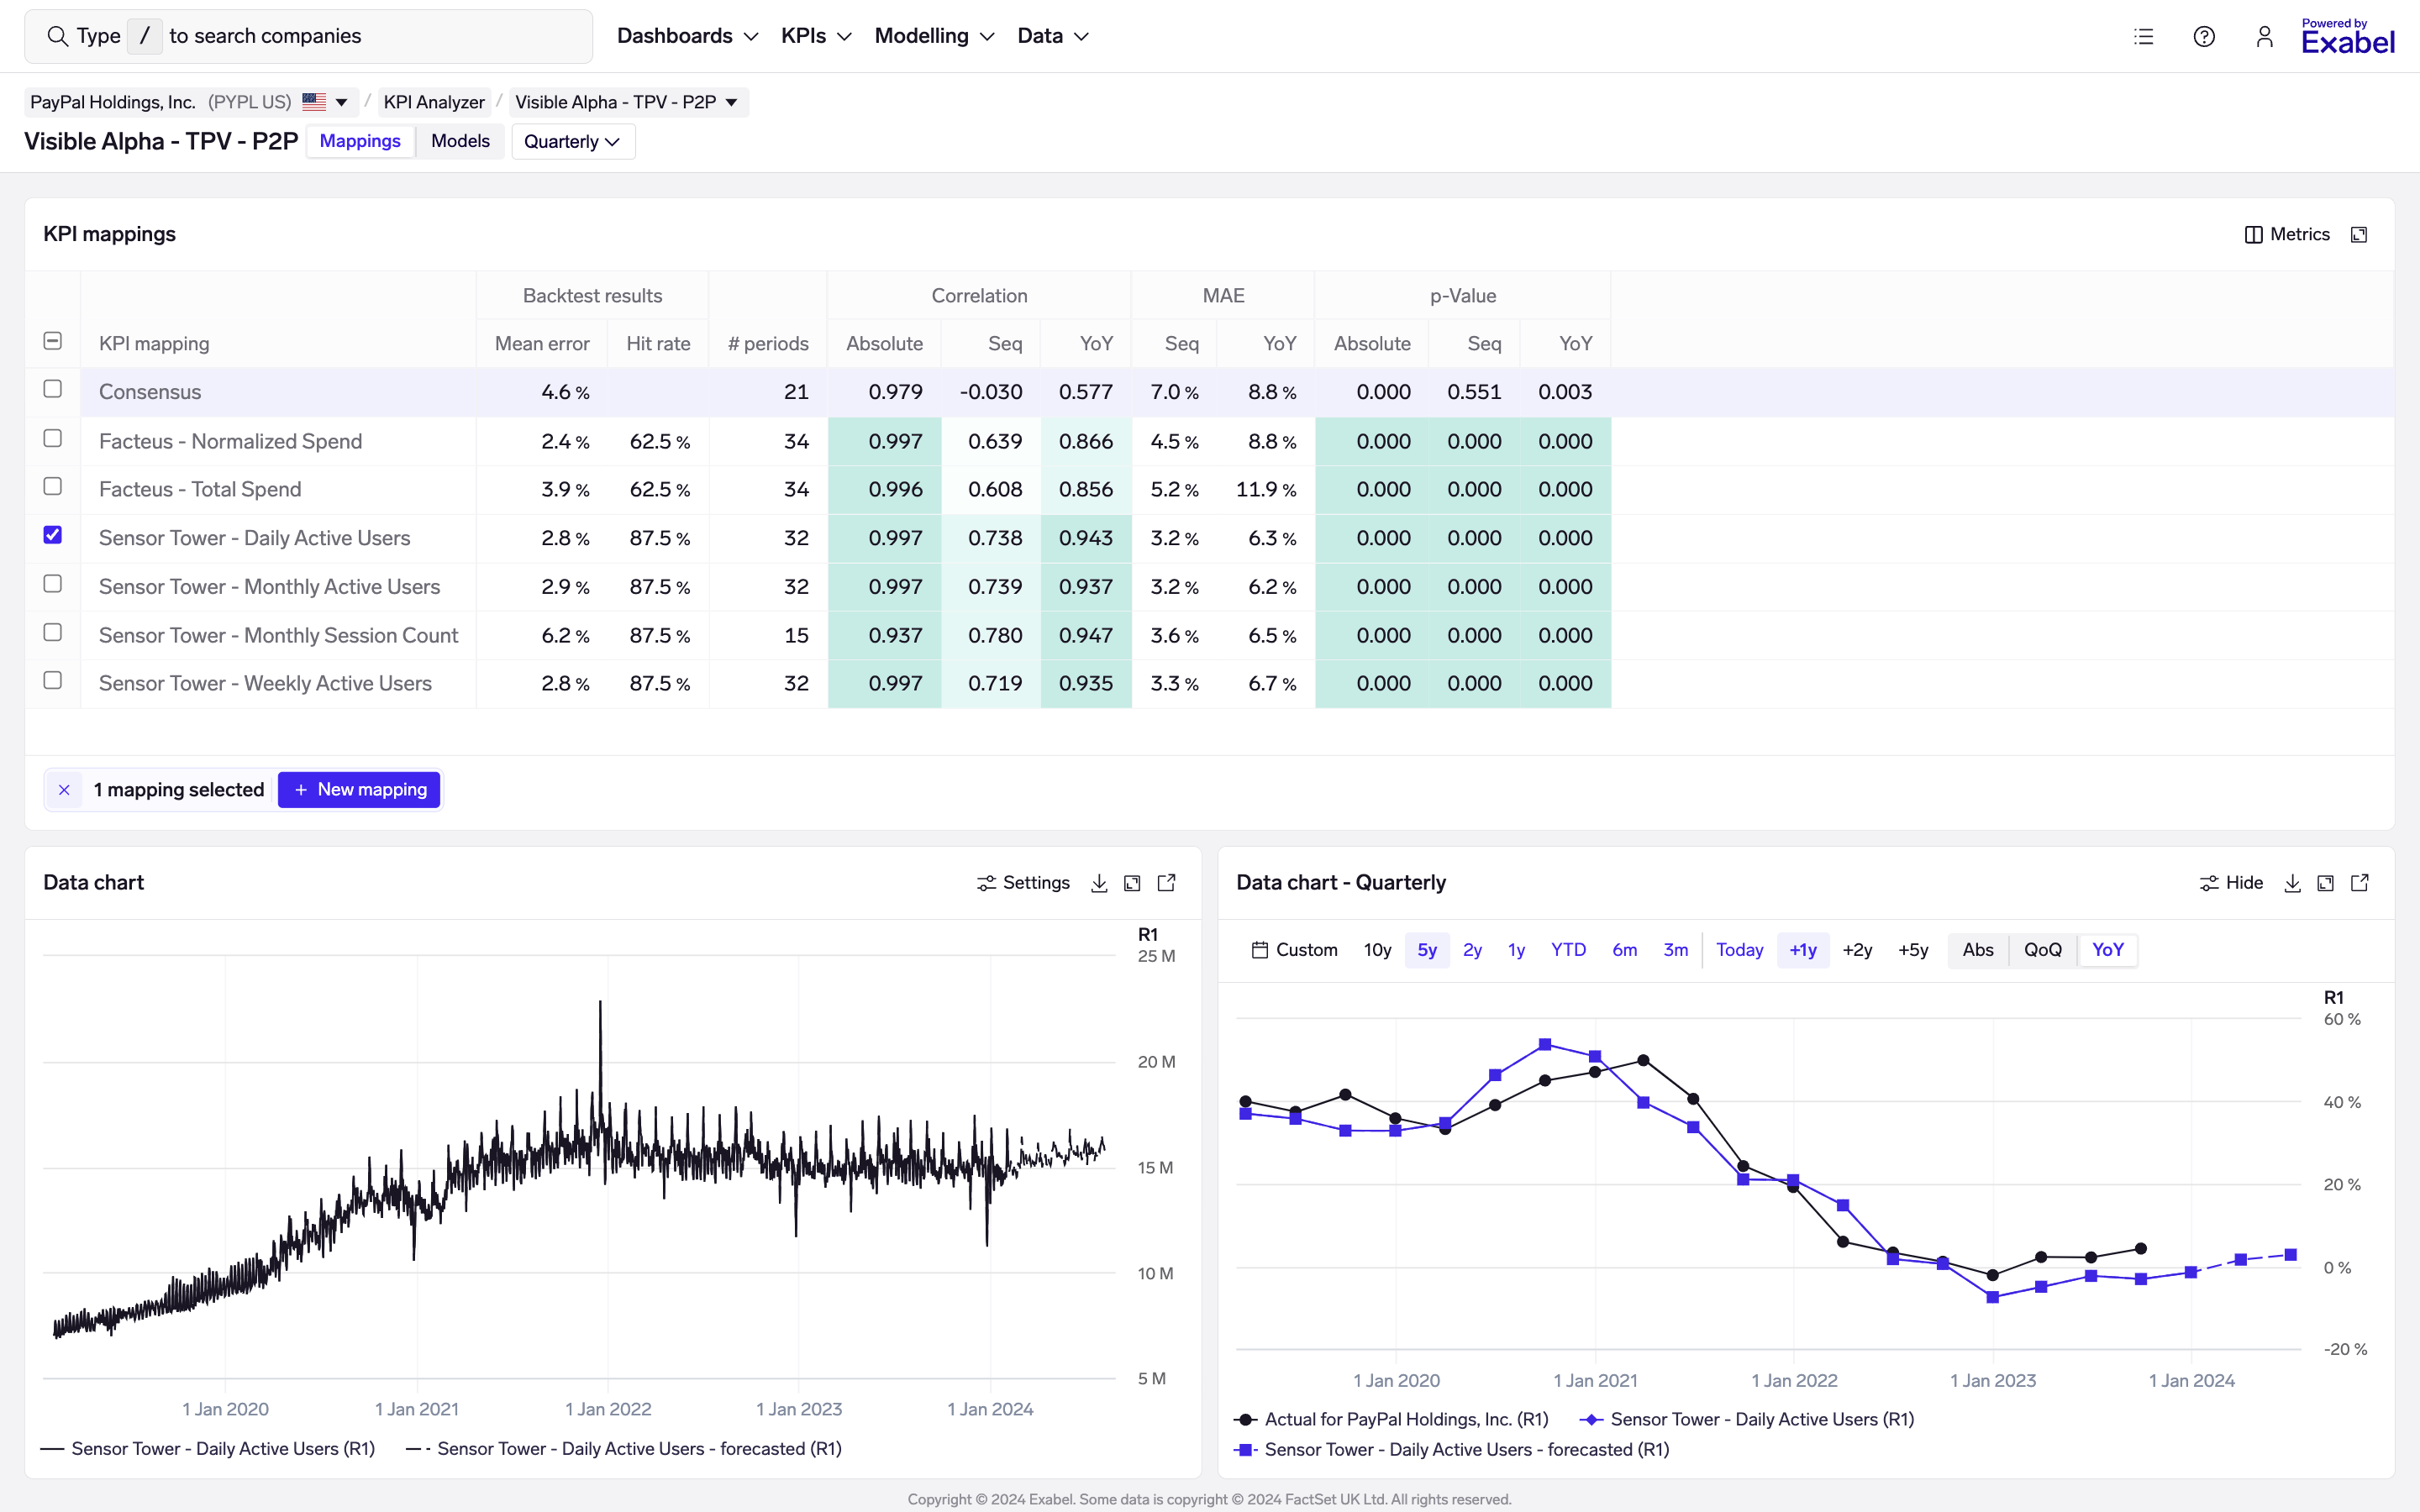
KPI Analyzer Mappings view
From here, you can switch between KPIs by clicking on the KPI dropdown at the top of the screen, or switch to Models view by clicking on the Models button.
Models view
The Models view is also specific to 1 KPI for 1 company, and shows model predictions and other model-related details.
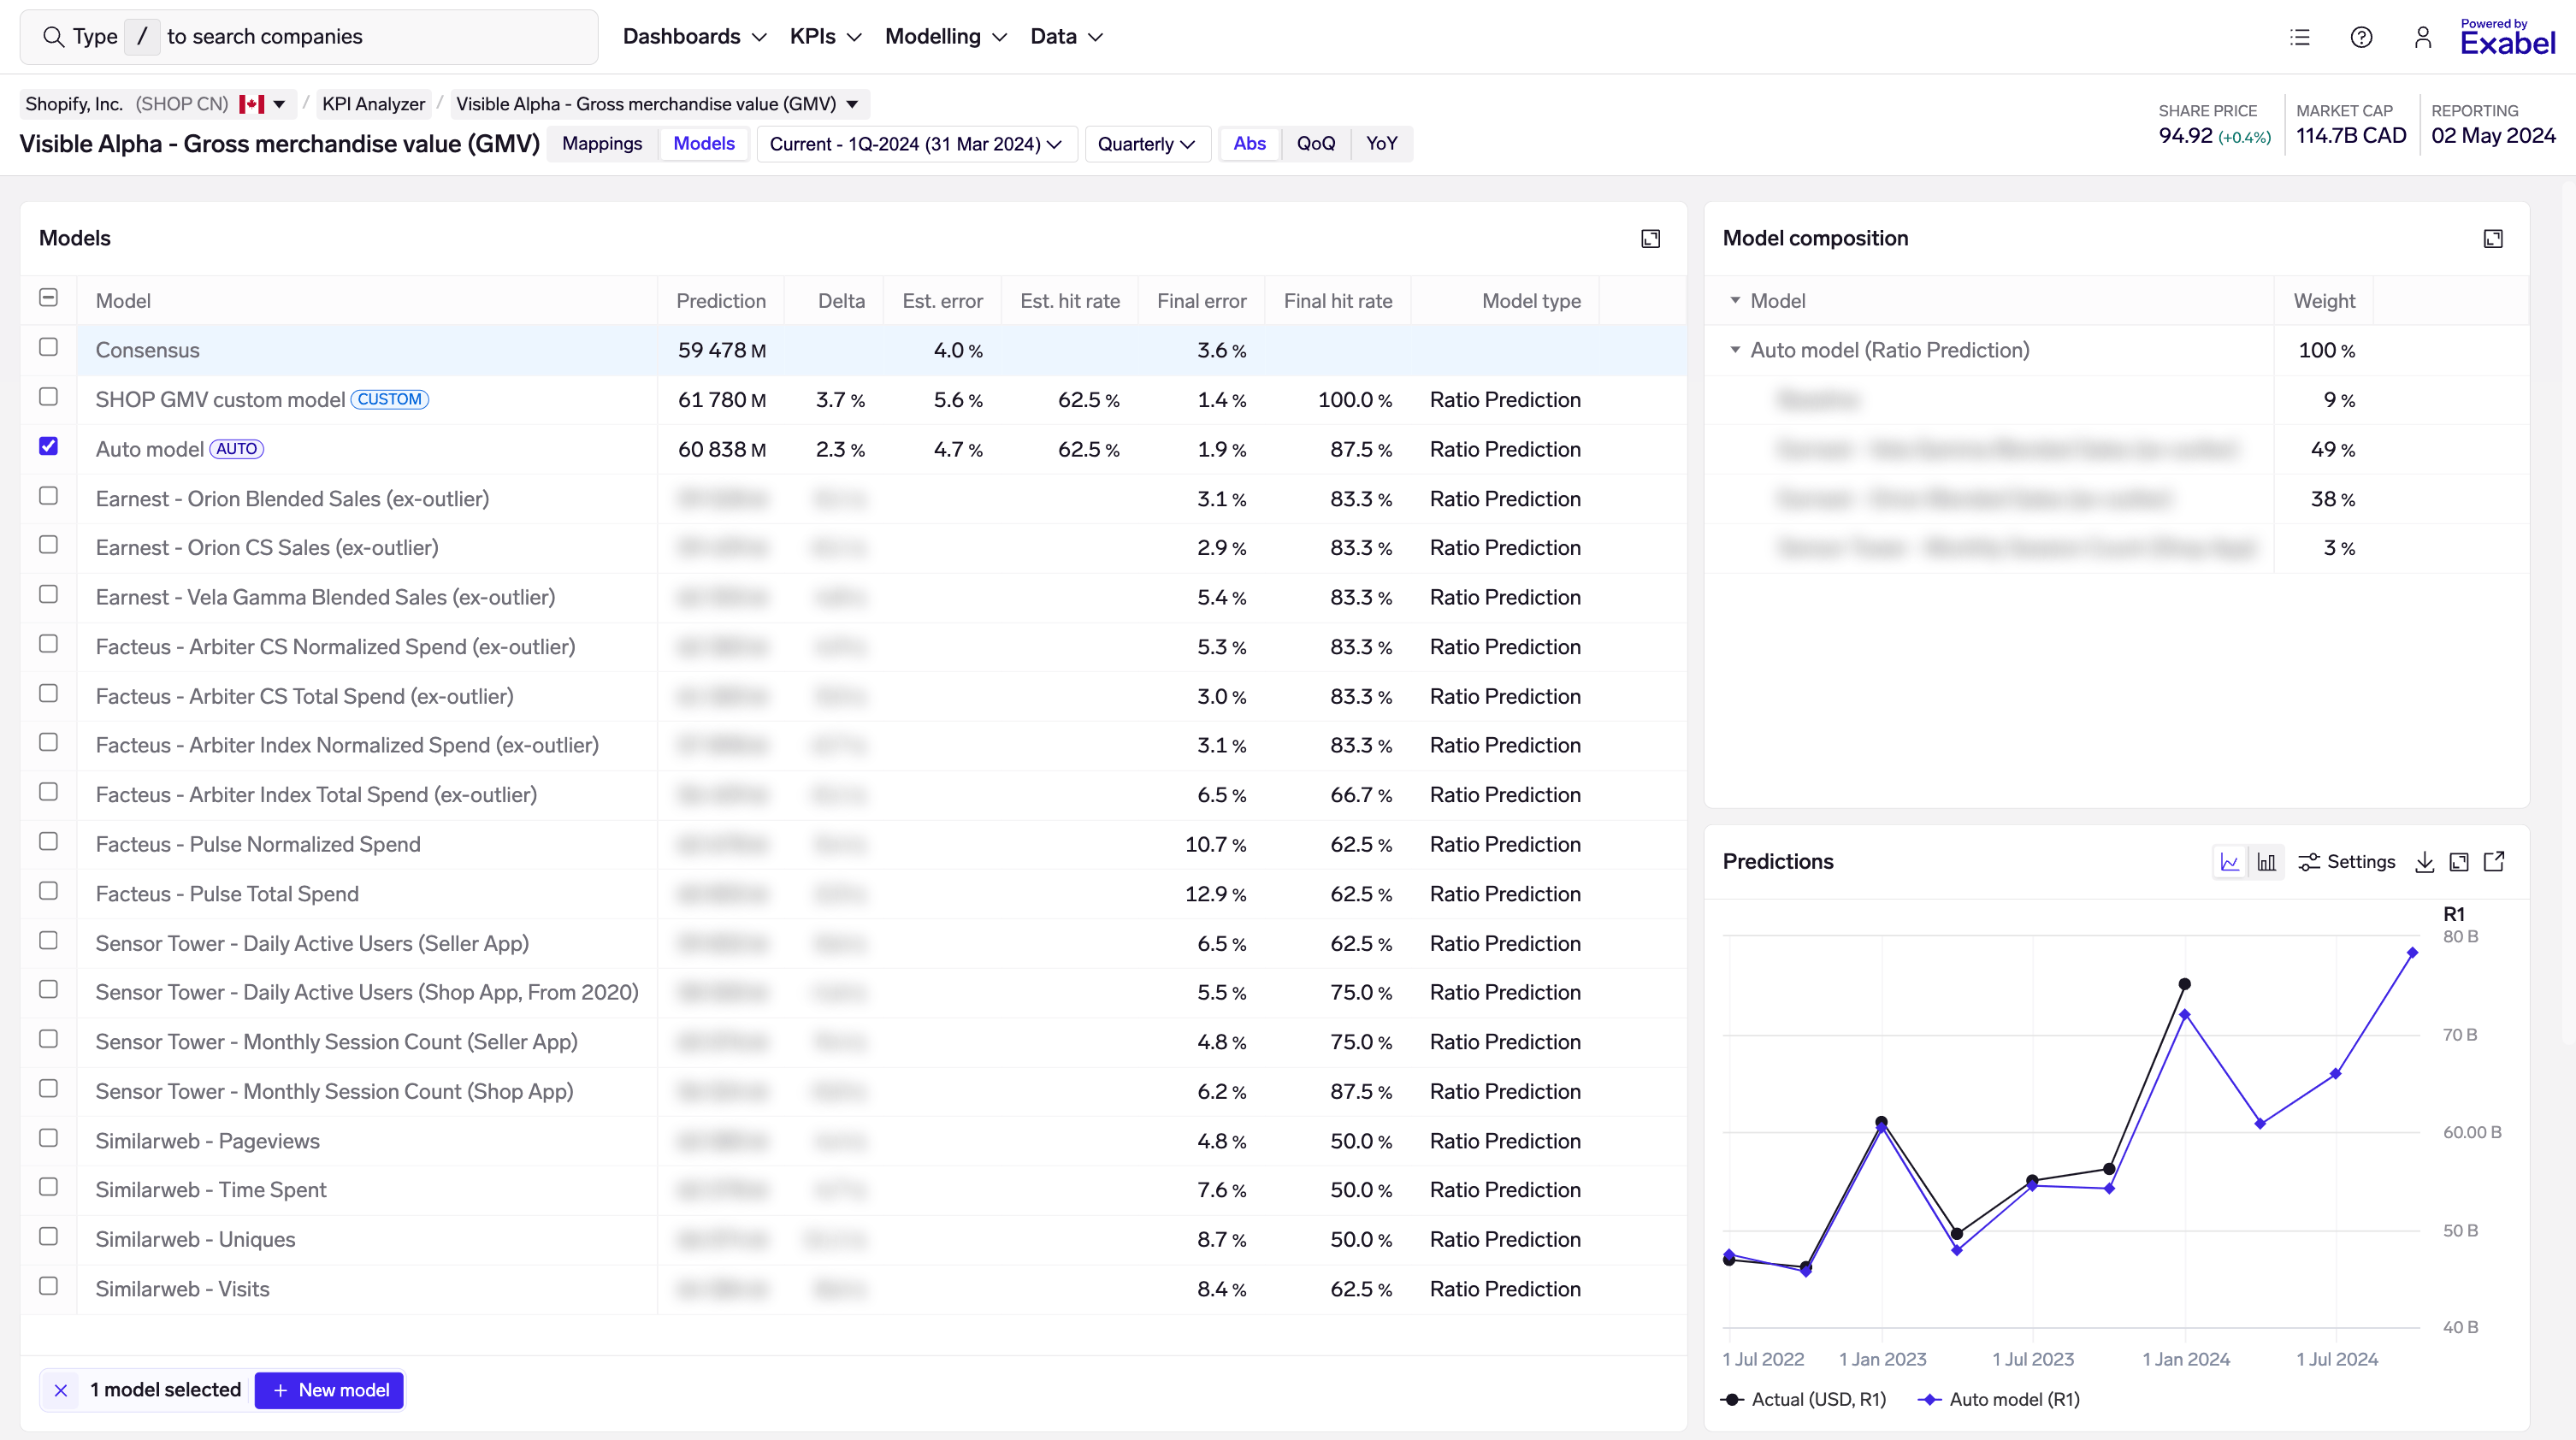
KPI Analyzer Models view
From here, you can switch between KPIs by clicking on the KPI dropdown at the top of the screen, or switch to Mappings view by clicking on the Mappings button.
Updated about 2 months ago
What’s Next
Learn more about mapping, modelling and monitoring in the KPI Analyzer