Using signals
Use pre-built signals, or build new signals with custom transforms
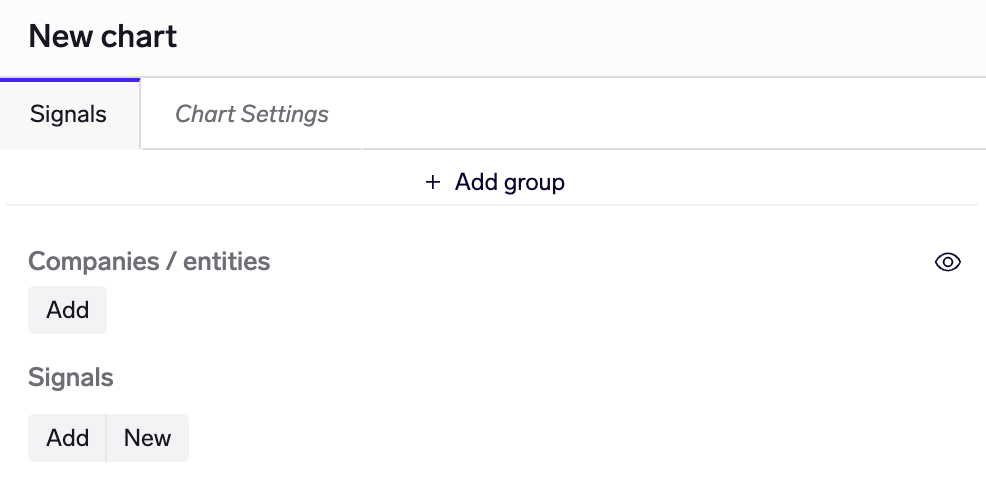
All work in Plotter, and more broadly throughout Exabel, involves working with signals. You have 2 main options when it comes to signals:
- Use existing signals: found in the Library, shared with you by your teammates / vendors, or previously created by yourself. These may be added to Plotter by clicking on "Add".
- Add signals from Data Explorer: add entities, signals and time series from Data Explorer into your chart.
- Build your own signals: these allow you to customize your own data transforms using signal expressions. You can create new signals by clicking on the "New" button.
Existing signals
Clicking the "Add" button will open your Library in a modal, where you can search and browse for a signal.
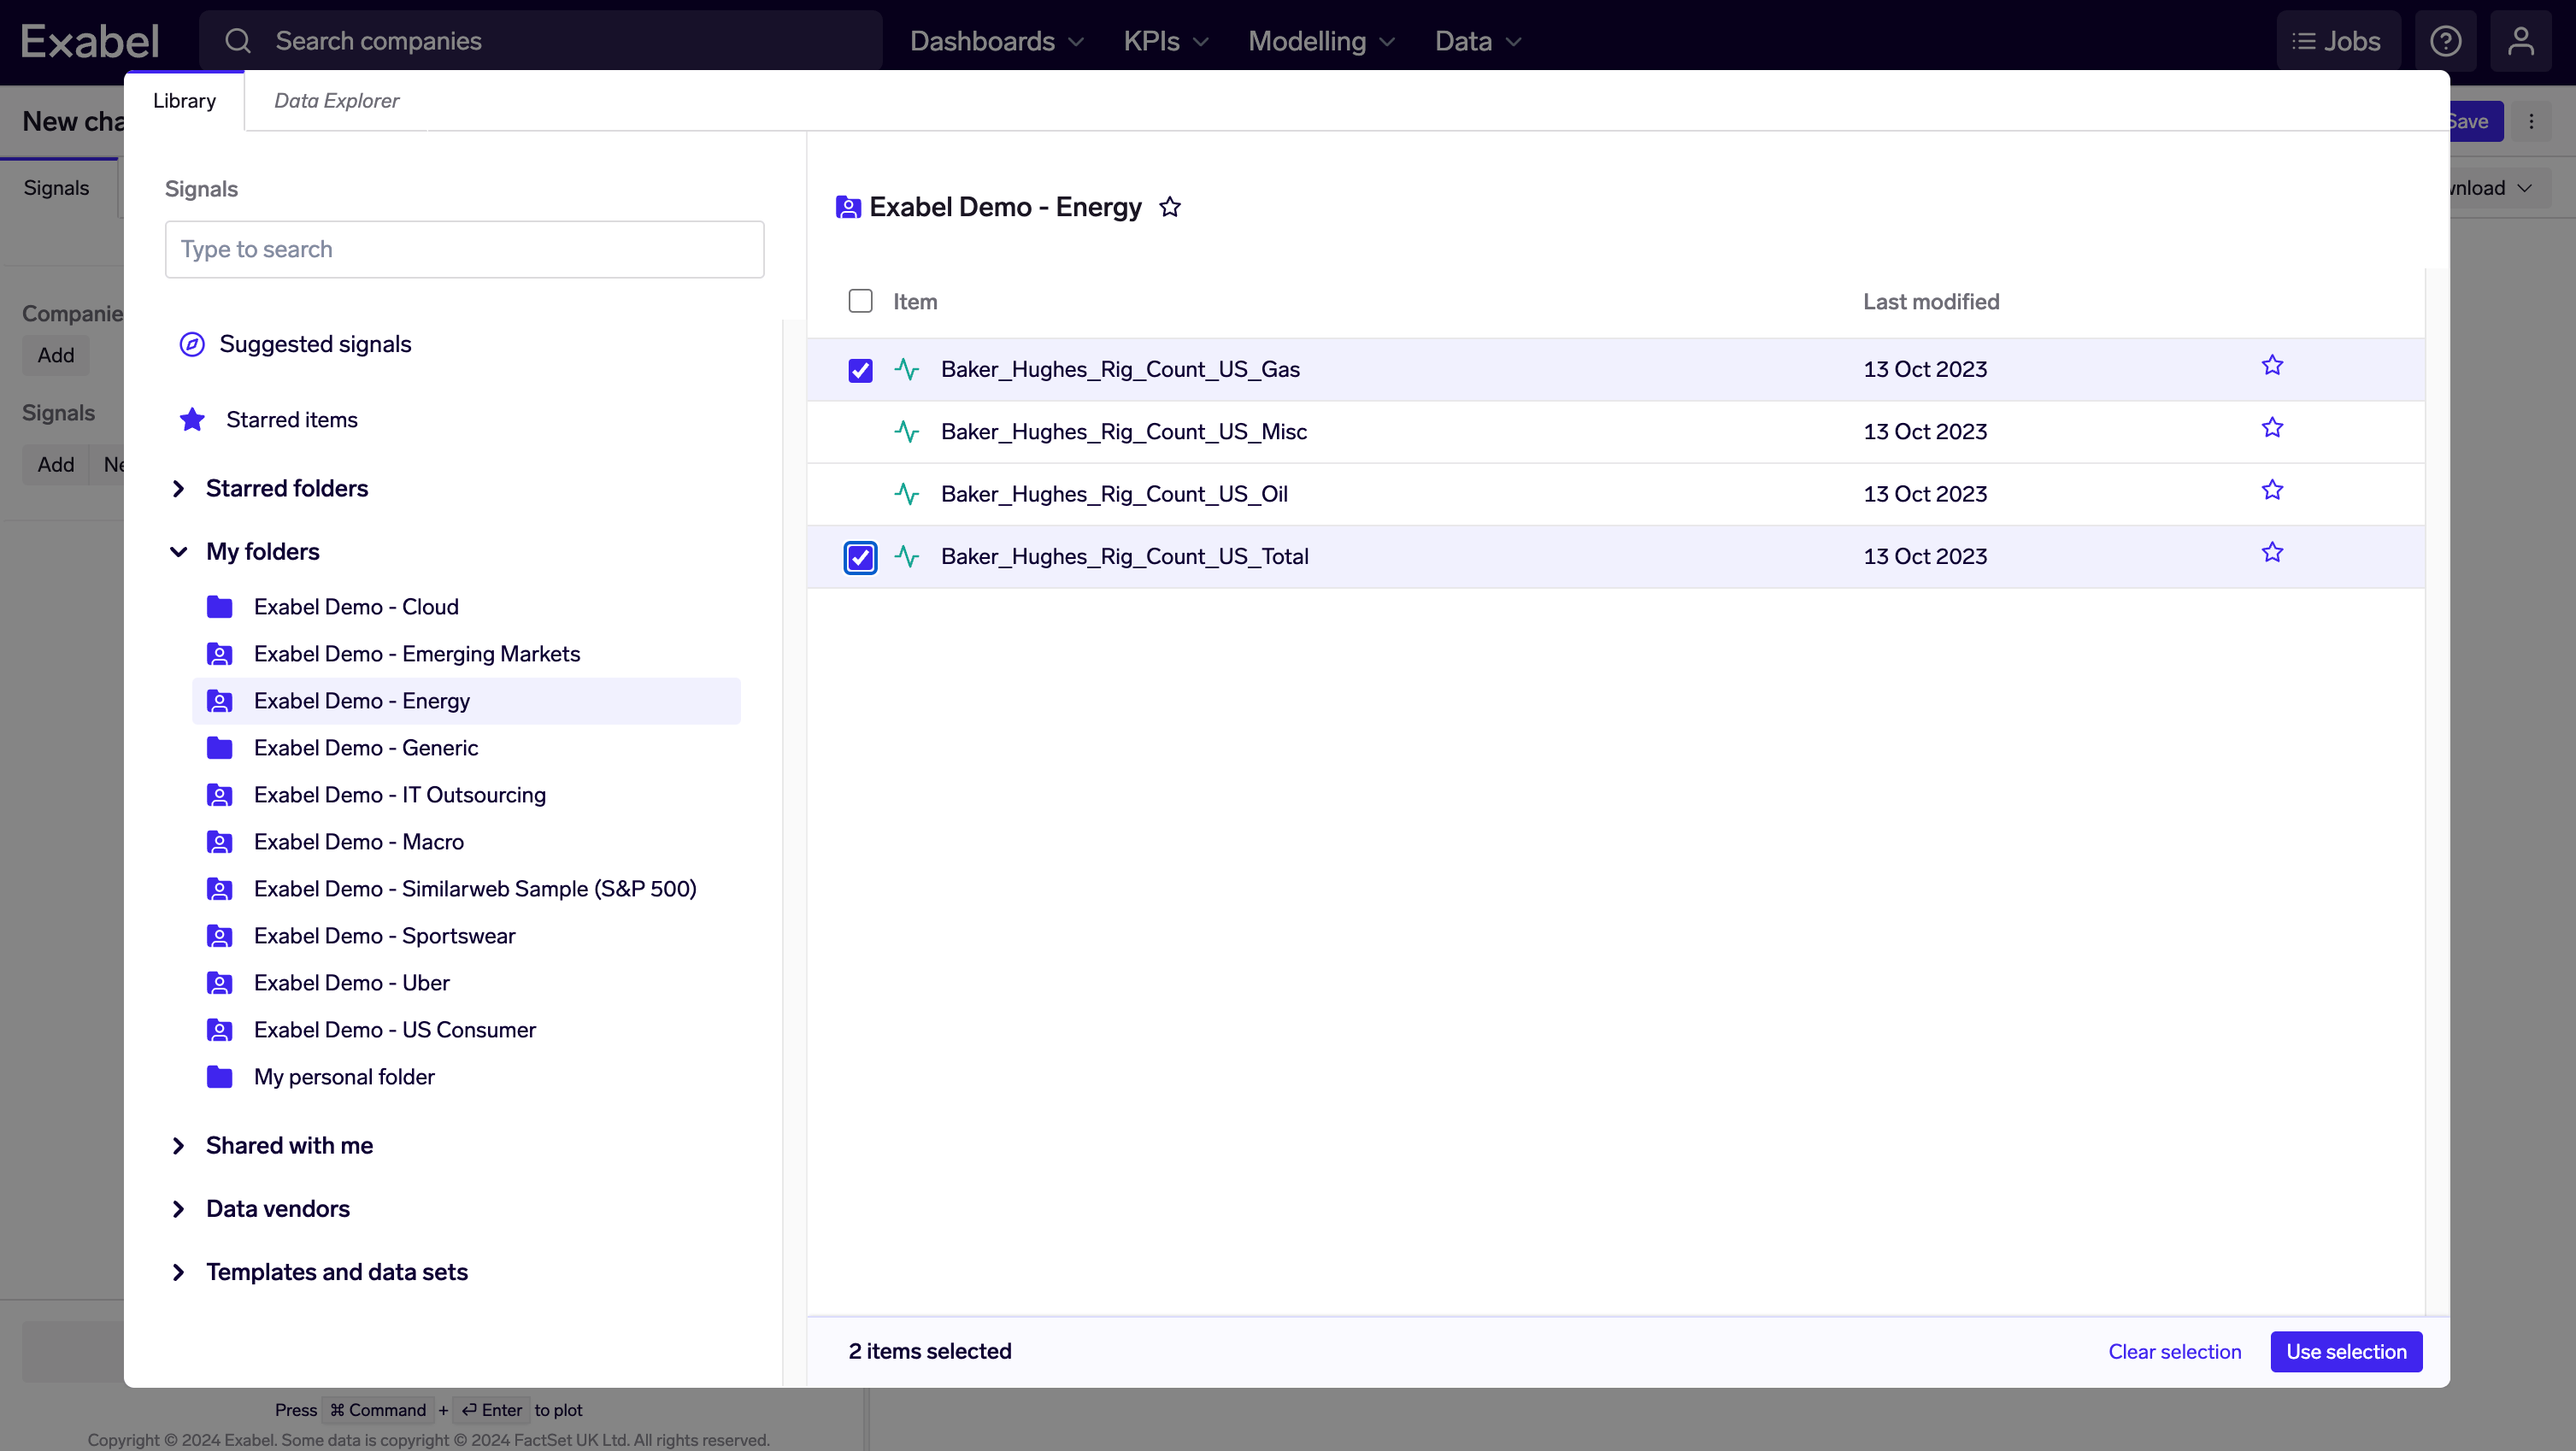
The sidebar is organized to allow you to easily navigate your Library, with sections for your own folders, shared folders (from your teammates), and vendor folders. Alternatively, you can type in the search bar to look for a specific signal.
You can click on a signal to add it immediately to Plotter, or use the checkboxes to select multiple signals to add.
Add from Data Explorer
While Plotter always uses derived signals to plot charts, it is also possible to add raw signals from Data Explorer. New derived signals are automatically created for you to retrieve the data you select.
Quick reminder - raw vs derived signalsRaw signals contain the raw time series data imported by yourself / vendors via the Exabel Data API.
Derived signals are signal expressions that retrieve raw signals and optionally apply transformations to this data, ultimately producing time series.
To add from Data Explorer, click the "Add" button and change to the "Data Explorer" tab in the modal. Then, browse to a data set of interest, and filter/search for the data you want. You can add entities, signals, or time series to Plotter by clicking on an entity type in the graph, and choosing from the "Entities", "Signals" and "Time Series" tabs. Finally, select what you would like to plot in your chart and click "Use selection".
We recommend adding time seriesIn order to plot time series in your chart, you should select & add time series from Data Explorer. This populates both the "Companies / entities" field, and generate new derived signals that retrieve those raw signals. It is the combination of entities + signals that is used to produce time series.
Adding entities will only populate the companies/entities field, while adding signals will only generate derived signals that retrieve those raw signals.
Build new signals
Building new signals allows you to customize how data should be transformed for your chart. This can be as simple as applying a moving average / YoY transform, to more complex operations that combine data from different signals / vendors, or apply more advanced statistical transformations.
You can either build a new signal from scratch by clicking on the "New" button, or clone an existing signal to tweak it further.
The f(x) button provides a list of common transformations that can be applied to an existing signal. There is a much larger set of functions available beyond what is shown in the menu - see signal expressions for more details.
You may want to name your signals as in the example above, which can help you better organize your work. This is optional unless you are saving your signal.
Saving signals
Saving your signal expressions is useful if you want to re-use them in multiple charts, or in other features (dashboards, financial models, alerts, KPI analysis, etc.)
To save a signal, you will need to give it a unique name. (If you attempt to save a signal with the same name as another signal in your Library, we'll prompt you to choose a different name.) Then click "Save to library" and your signal will be saved to your personal folder in the Library.
You can edit any signal that you create, or that your teammates have shared to you with write permissions.
Editing a saved signal will update it everywhere elseNote that if you edit an existing signal and save its change, this will affect it everywhere it is used, including other charts, dashboards, models, etc.
Updated 2 months ago