January 2024 update
The latest release introduces a company-centric Data Explorer for easy navigation and comparison of data sets, while the KPI Analyzer now supports adding new KPIs and improved visualization of data trends. We've enhanced currency support to allow setting currency during data import and simplify currency conversion in signal expressions. The update also includes an improved application navbar, print-to-PDF for dashboards, and many more enhancements and bug fixes.
New features
Company-centric Data Explorer
We have introduced a new company-centric Data Explorer that allows you to easily browse all data sets for a company, visualize time series across different levels of granularity, and compare across data sets.
To find this, simply search for a company, and open its Data Explorer page from the dropdown at the top of the page.
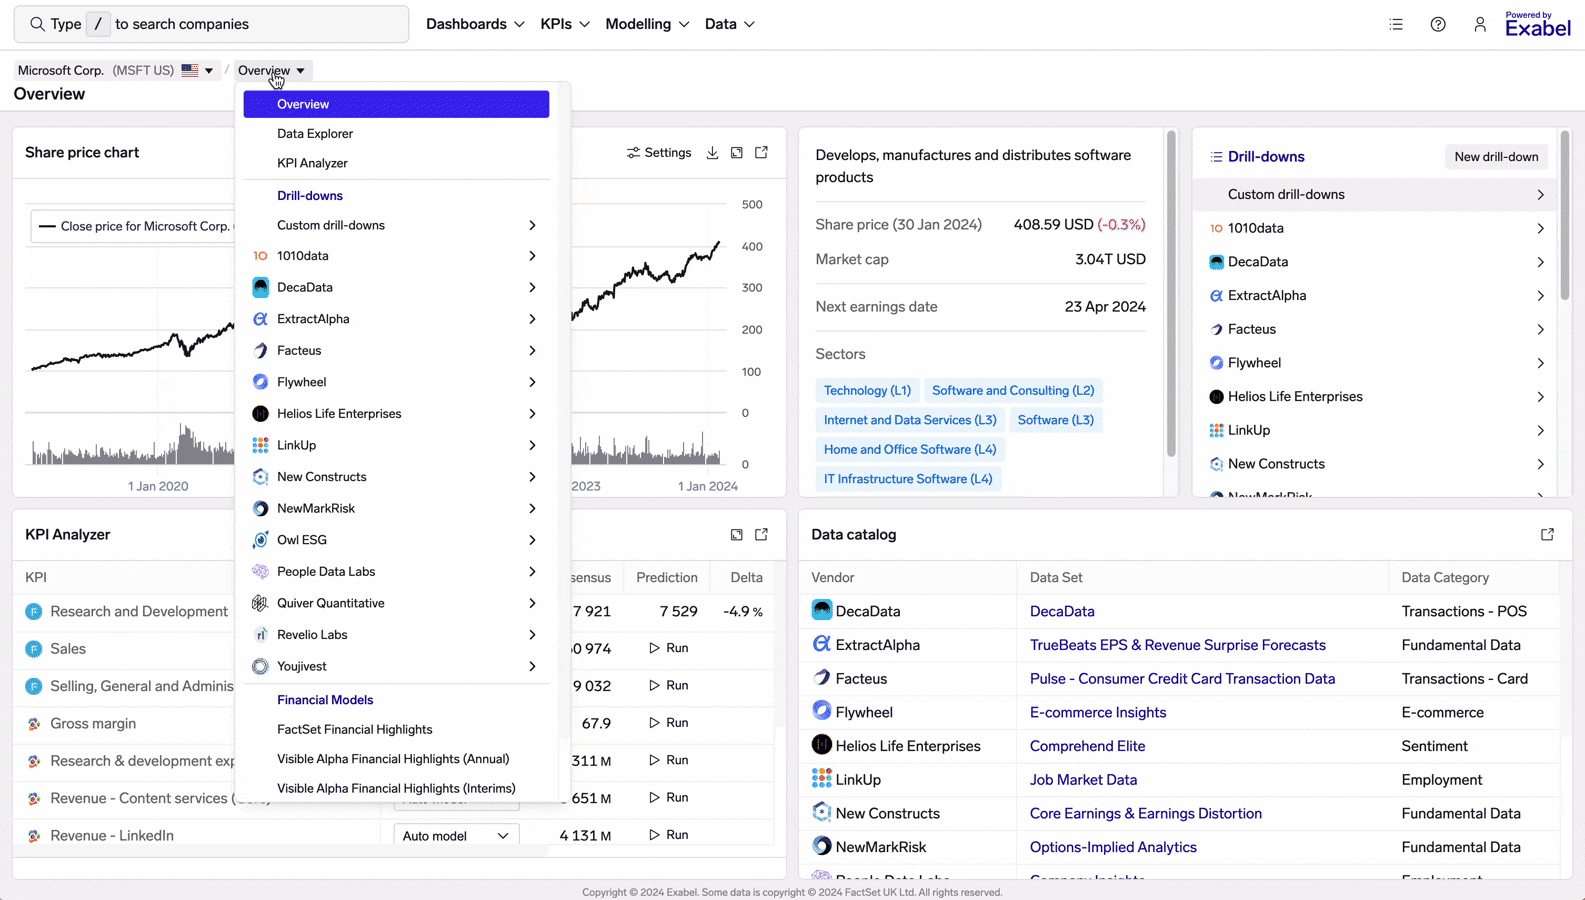
Browsing available data for Microsoft
The sidebar shows all data sets (including your own) that cover the company. Each data set may be expanded to show the levels of granularity (entity types) on which data is available, and the individual time series.
KPI Analyzer - add a new KPI, and more data charts
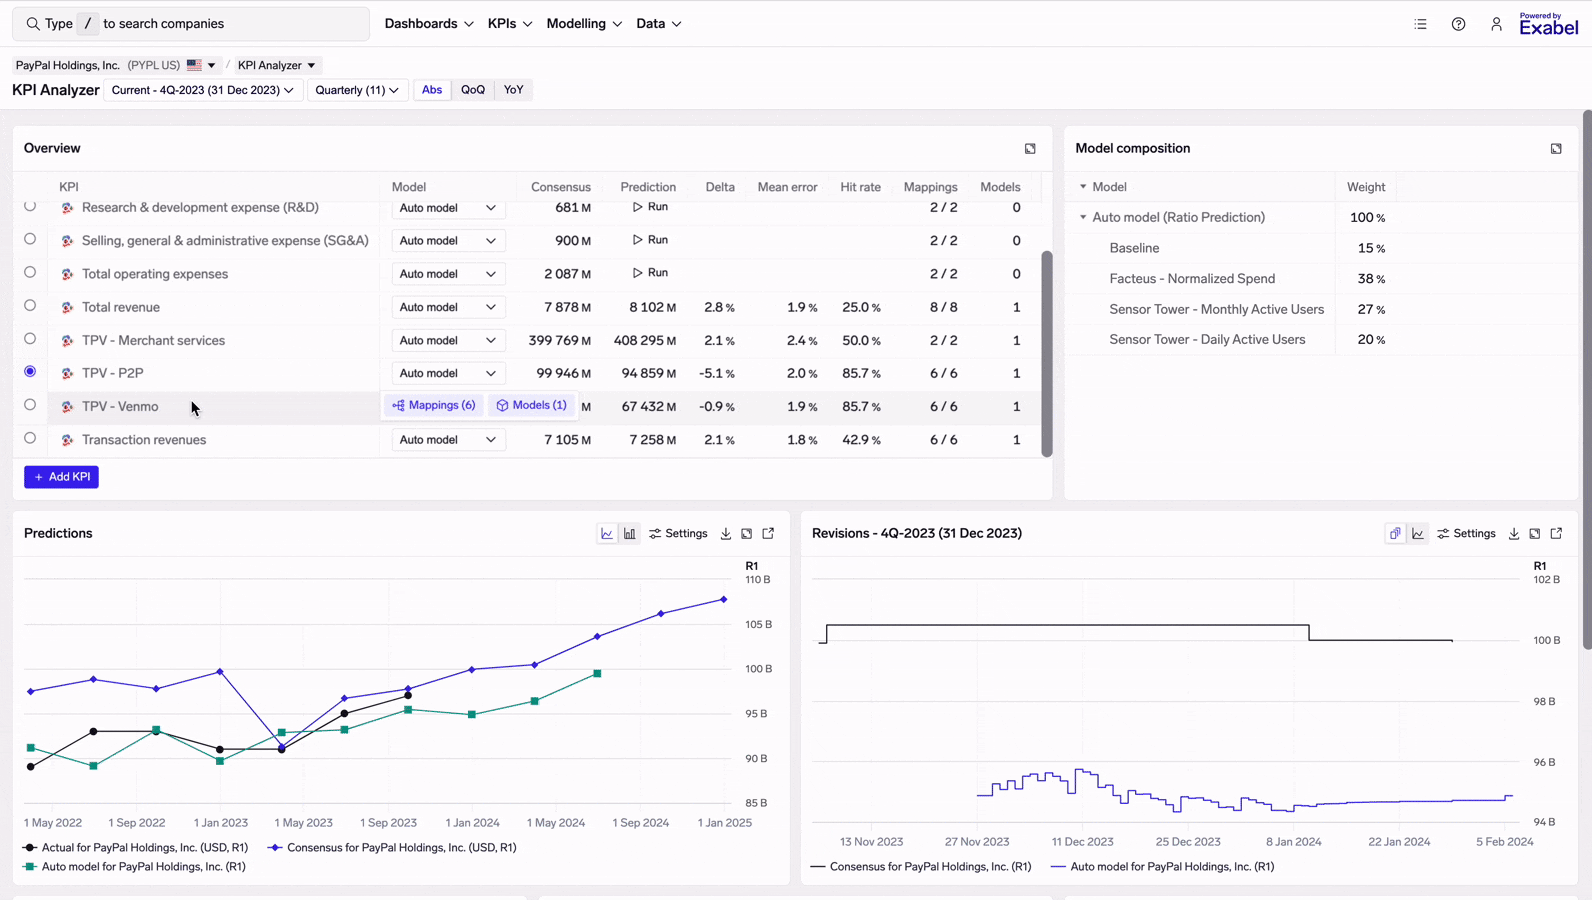
Adding a new KPI
While Exabel spends a significant amount of time to curate vendor data and map it to relevant KPIs for each company, you may find that your investment thesis involves a different KPI that perhaps vendors or the broader market is not paying attention to. It is now possible to add a new KPI to your KPI Analyzer view, and create your own custom mappings & models for that KPI. This allows you to create new insights that are proprietary to yourself and your team/firm. See the user guide for more details.
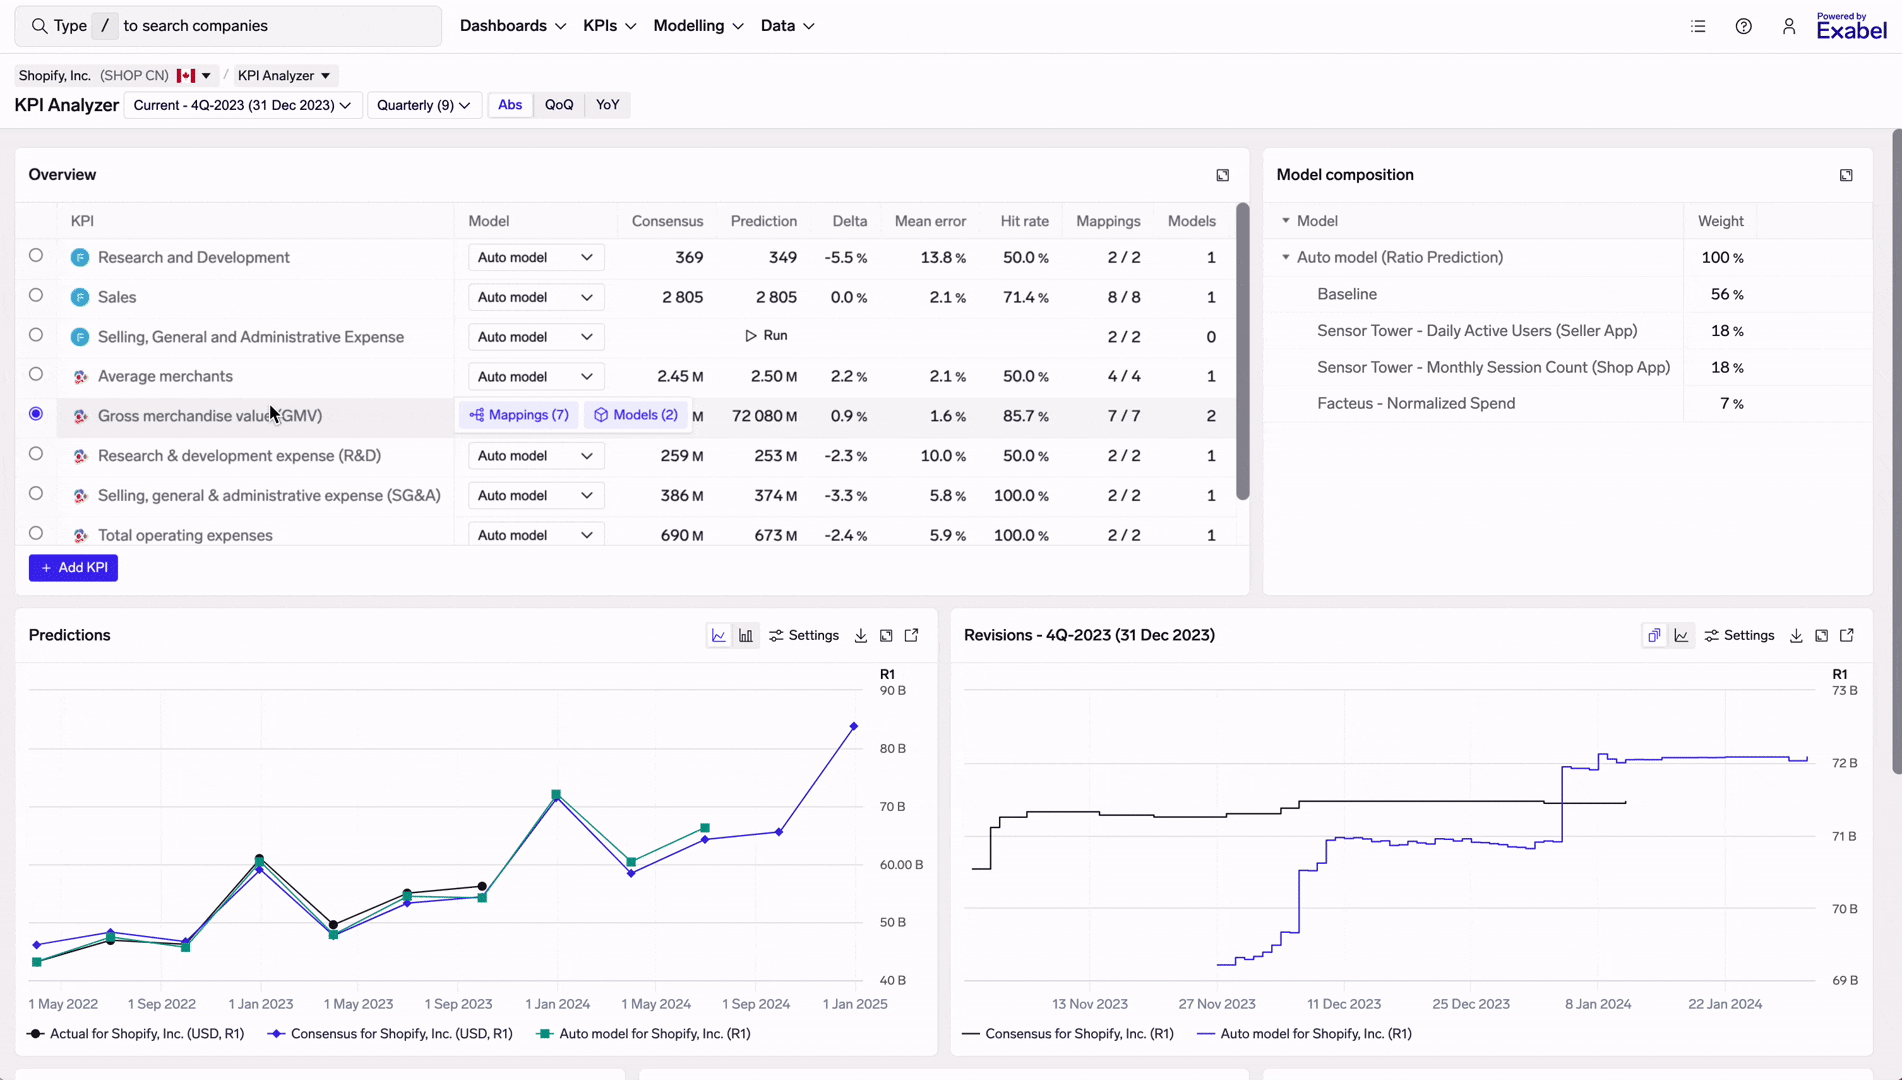
Visualizing the underlying card and mobile app data mapped to Shopify GMV
On the main KPI monitoring view, we've also brought in additional widgets to help summarize and plot data trends. When you select a KPI, the "KPI mappings" widget will show you all KPI mappings for that KPI, together with the latest date for which data is available, and QoQ/YoY trends. The 2 data charts then show you the underlying data, and the data on a quarterly basis. There are also options to switch to QoQ/YoY views.
Improved currency handling
It is now possible to set a currency for each time series when importing data. See the data import user guide for details about how to do this. When retrieving data, the currency is also returned, and displayed in charts and tables.
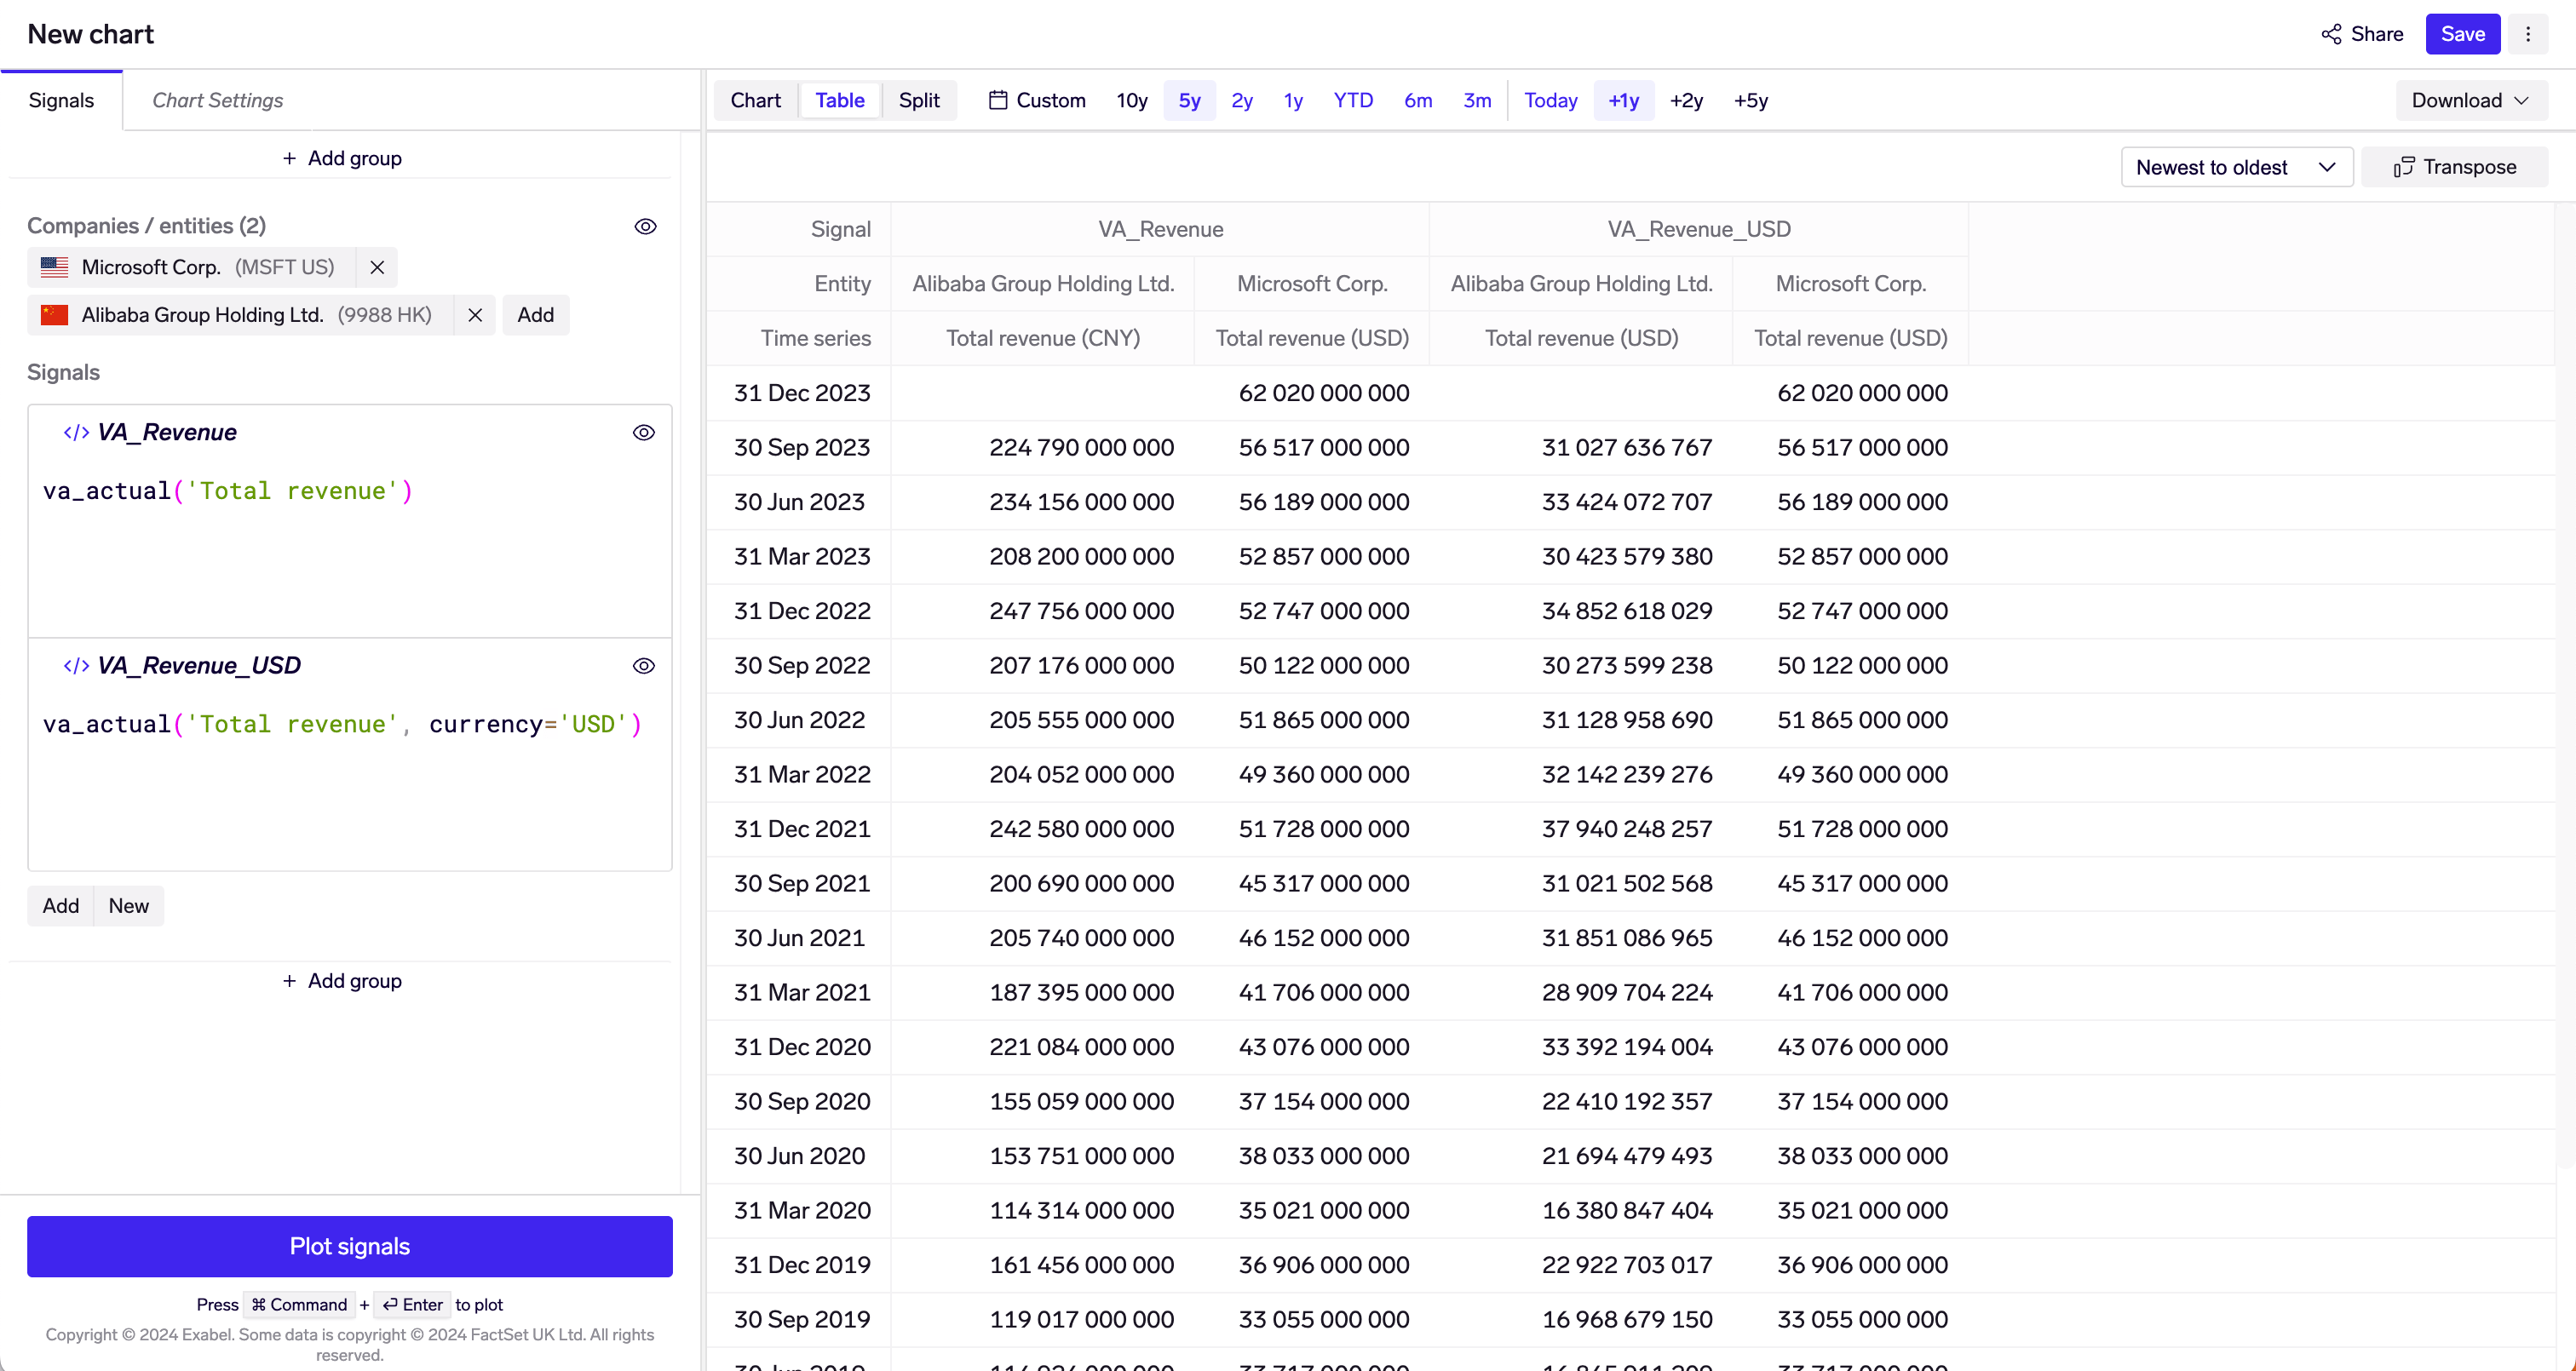
Retrieving revenue for Microsoft and Alibaba, in the reporting currency and in USD
This currency metadata is now available on for FactSet and Visible Alpha actuals / consensus. When using the DSL functions to retrieve FactSet / Visible Alpha data, you may now specify a currency parameter to convert it to a different currency.
By default, with FactSet & Visible Alpha KPIs, we use the average exchange rate in each fiscal period to do the conversion. For balance sheet ("stock") KPIs, you may set currency_method='last' to use the period-end exchange rate for conversion.
If you have uploaded your own data with currency metadata, you may use the convert_currency() function to easily convert this into another currency.
Currency handling in data transformationsMany data transformations will preserve the currency metadata - e.g. if you
delay()a signal that is in USD, the resulting transformed signal will still be in USD. Other transformations (e.g. percentage change) will cause the currency to be lost.The following commonly used functions preserve the currency metadata:
abs(), clip(), truncate(), drop_last(), change(), agg_change(), resample(), weekly(), monthly(), upsample(), moving_average(), smooth(), rolling_aggregation(), delay(), reindex_like(), filled_daily(), align_to_dates(), aggregate_over(), forecast()
If there are additional functions that you believe should also do this, please let us know at [email protected].
Enhancements
- Overall: The application has got a new and improved navigation header, including type to search and keyboard navigation.
- Dashboards: Support printing to PDF.
- Charts: Categorical column and bar charts can now be grouped by company/entity or time series label.
- KPI Analyzer: When training a custom ratio prediction model, we now show a comparable backtest error for the model baseline. (The model baseline uses only the KPI's reported values to predict its next values, and can be used as an input to the model.)
- KPI Analyzer: Display the weight for all input KPI mappings used in a custom model, even if they have been given 0 weight. This helps make clearer if there were any inputs selected by the user, but not used by the model.
- KPI Mapper: New overview page for KPI mapping collections.
- KPI Mapper: Streamlined the user interface for creating new company-specific KPI mappings.
- KPI Mapper: It is now possible to copy a company-specific mapping to another KPI collection. This is helpful for creating mappings in a separate test collection, and moving them to a production collection of KPI mappings subsequently.
- KPI Mapper: Display details of any errors or warnings (up to 10) that are reported for mapping groups.
- Entity search: When searching for an entities and there are many results, additional results will now be loaded when scrolling to the bottom.
- DSL: Persist the company calendar, which is used widely to retrieve FactSet/Visible Alpha data and align it to fiscal dates, as well as in many transformations such as resampling / aligning data to fiscal dates. Persisting the company calendar significantly improves performance when evaluating such signal expressions.
- DSL: Relative revisions may now be retrieved for FactSet and Visible Alpha KPIs. For example, it is now possible to write a signal expression like
va_revisions('Total revenue', '1FY')to retrieve revisions for the current (unreported) fiscal year. We are continuing to add more functionality here and will make a larger release announcement in the near-future. - DSL: Return FactSet & Visible Alpha line item names in the time series label, when using any of the FactSet/Visible Alpha DSL functions.
- Import jobs: Added confirmation prompt before deleting a stage configuration.
- Data API: Updates to TimeSeriesService methods Import time series, create time series, and update time series. For details, see the reference documentation.
- New parameter
insertOptionswraps the options used for inserting time series points. - New parameter
updateOptionsthat wraps the options used for updating time series series. - New insert option
shouldOptimize. - New update option
replaceExistingDataPoints. createTagno longer has any effect.- New parameter
unitsthat can be used to set the currency code for a time series.
- New parameter
Bug fixes
- KPI Analyzer: Fixed an issue when absolute predictions were displayed instead of QoQ/YoY trends.
- Data Explorer: Fixed some pagination bugs.
- Dashboards: Fixed an issue where a table would reload unnecessary when selecting an entity.
- DSL: Fixed many edge cases when building the company calendar (which is derived from FactSet data).