Plotter lets you visualize your data as charts, and quickly test out derived signals iteratively.
Click here to open Plotter, or from the Exabel menu, click "Plotter".
Getting started
You may visualize signals by selecting 1 or more companies, then selecting a signal from your Library, and clicking "Plot signals" (or with Ctrl-Enter or Cmd-Enter on your keyboard).
Visualizing a signal (daily close price) for Apple, Inc.
These are the most common options to explore:
Chart / table / split view: the table view shows your data in table form, and split view gives you both the chart and table at the same time.
Date range: change the date range being viewed.
Download: download or copy your chart to the clipboard; and also download/copy the data.
Companies / entities: choose one or more companies, entities (e.g. brands, apps) or tags to plot. Note that signal results are returned for a maximum of 20 companies/entities at a time, to keep a manageable amount of data being displayed.
Add group: create a separate group of companies/entities and signals.
📘
Using groups in Plotter
Within each group, all signals are plotted for all companies/entities. For example, if you select Apple and Amazon as companies, and Close_Price and Market_Cap as signals, you will see the close price and market cap for both Apple and Amazon (4 time series).
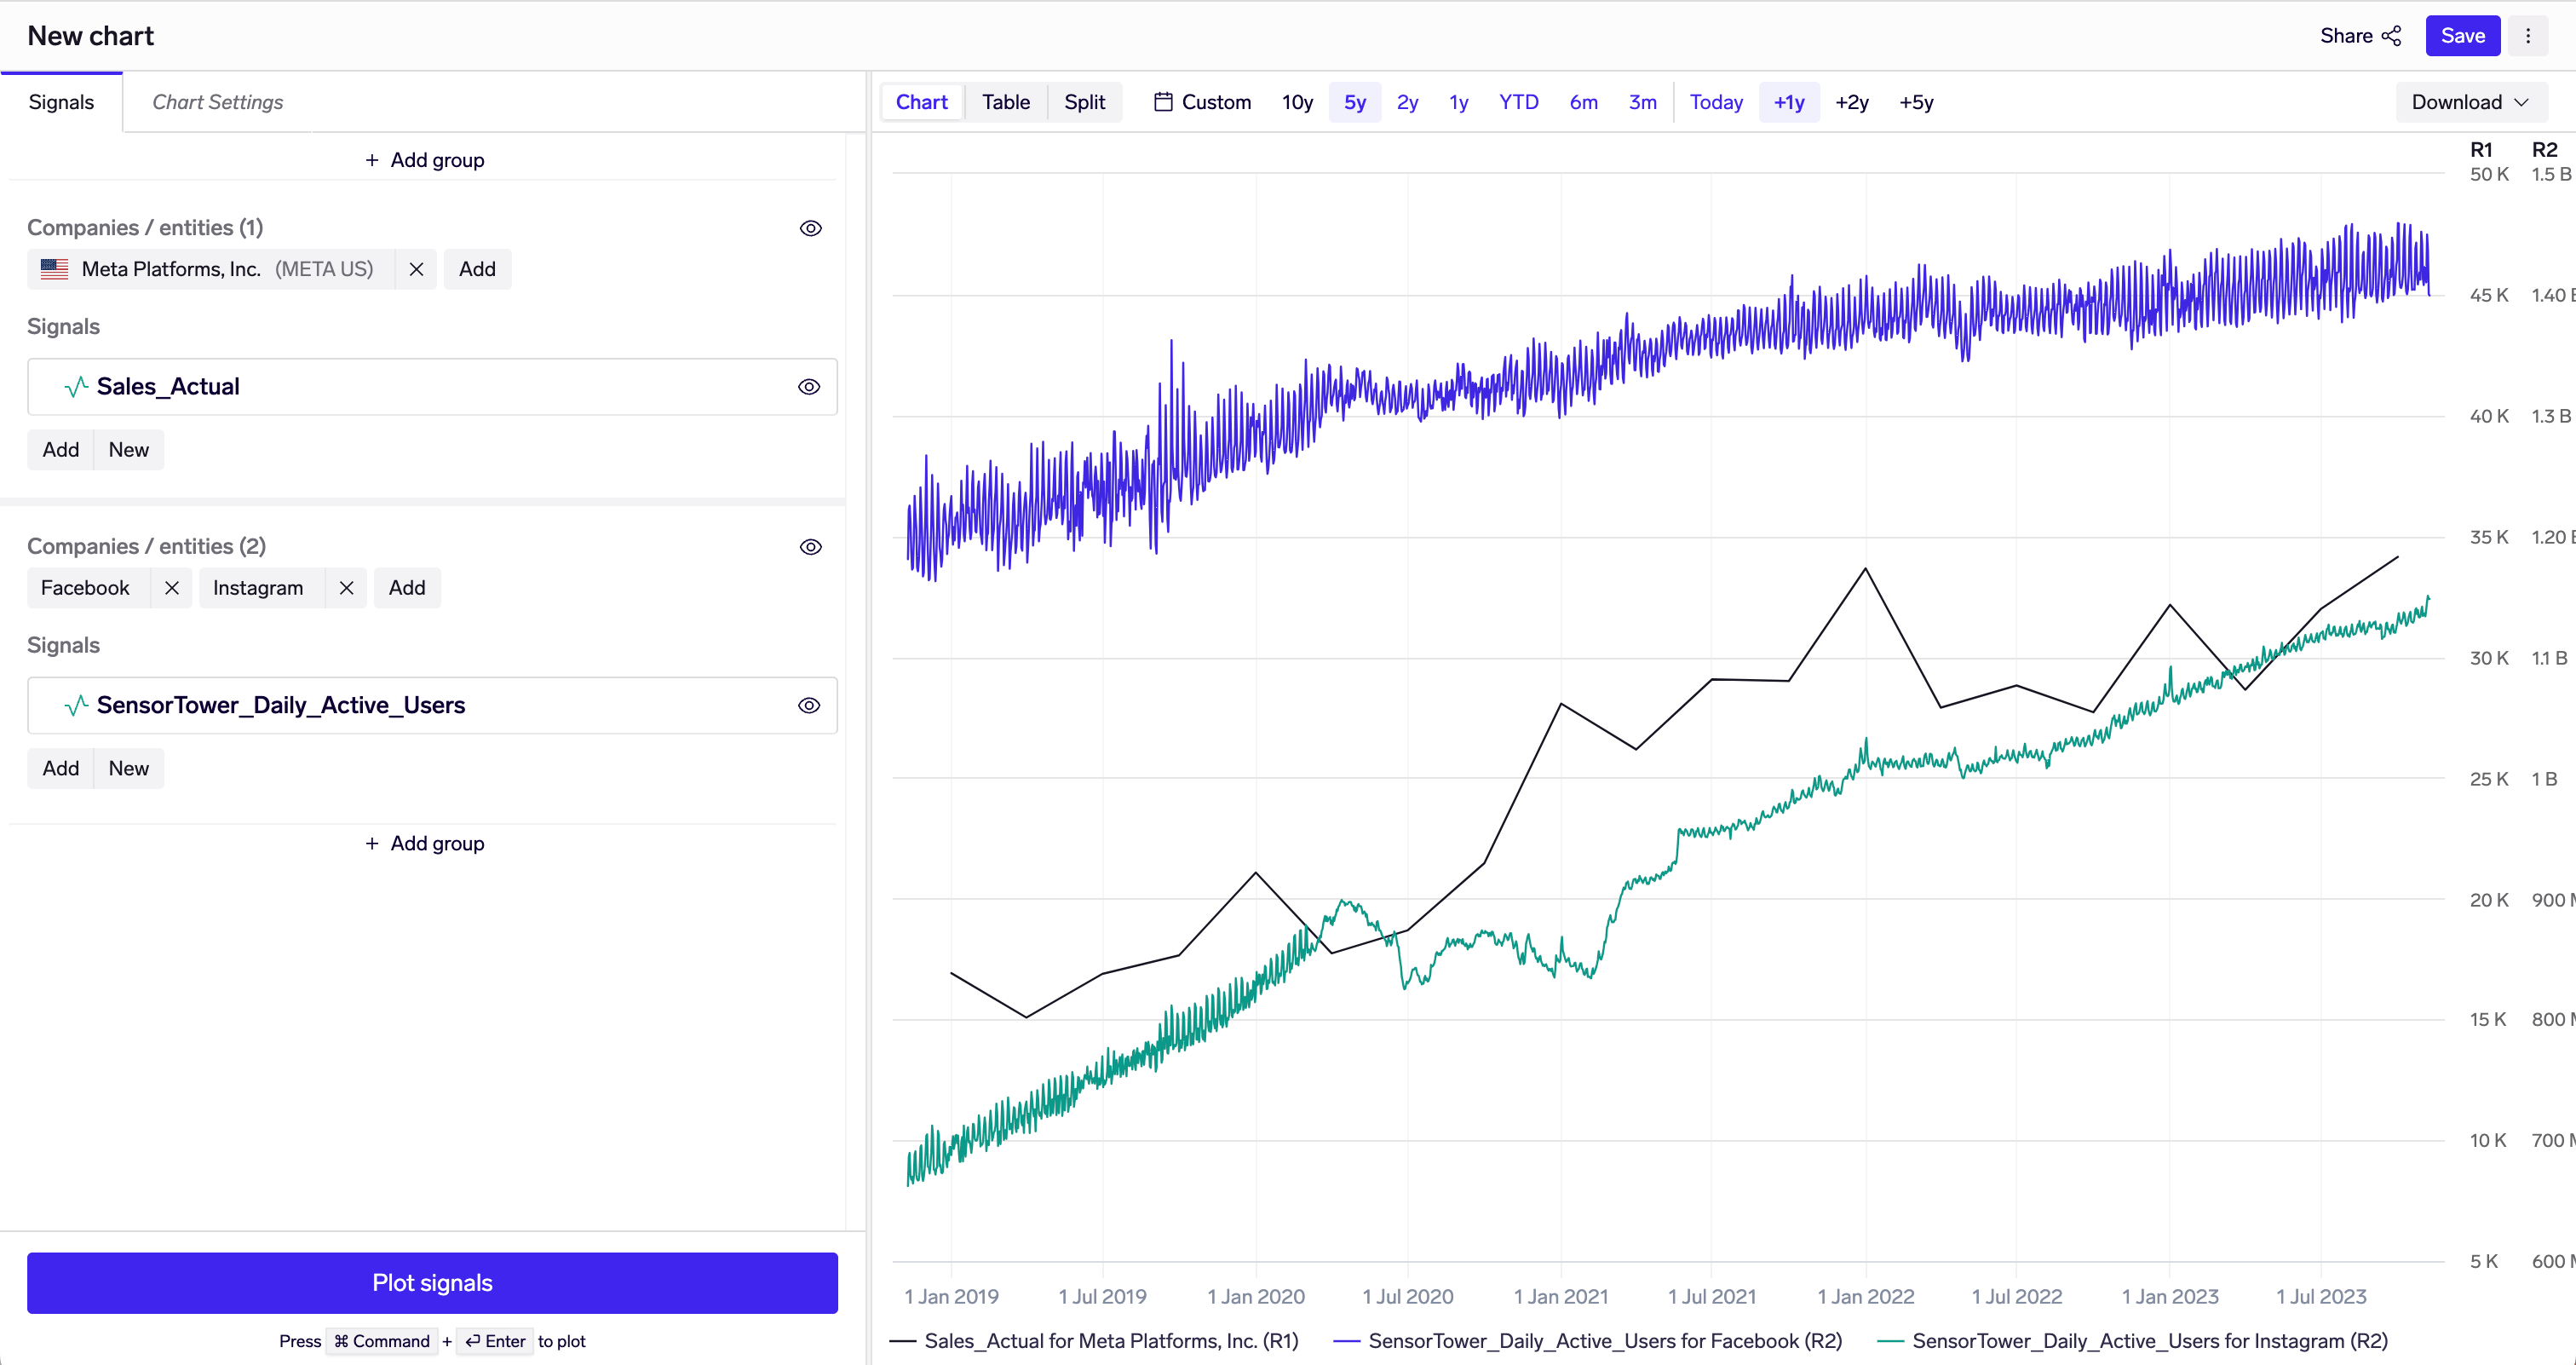
Sometimes, you will need to plot different signals for different sets of companies or entities. For example, you might want to plot the share price or revenue for a company, overlaid with usage metrics of mobile apps owned by the company:
Meta Platforms quarterly reported sales, overlaid with Sensor Tower app DAU for the Facebook and Instagram app entities.
Saving charts
Once you're happy with your chart, click "Save" at the top-right corner of the screen to save your chart to your Library. You can then easily come back to the chart, and share it with other colleagues.
Updated about 1 year ago
What’s Next
Learn more about customizing charts, developing signals, and doing advanced analysis in Plotter: