
Export charts
Render a saved chart as an image
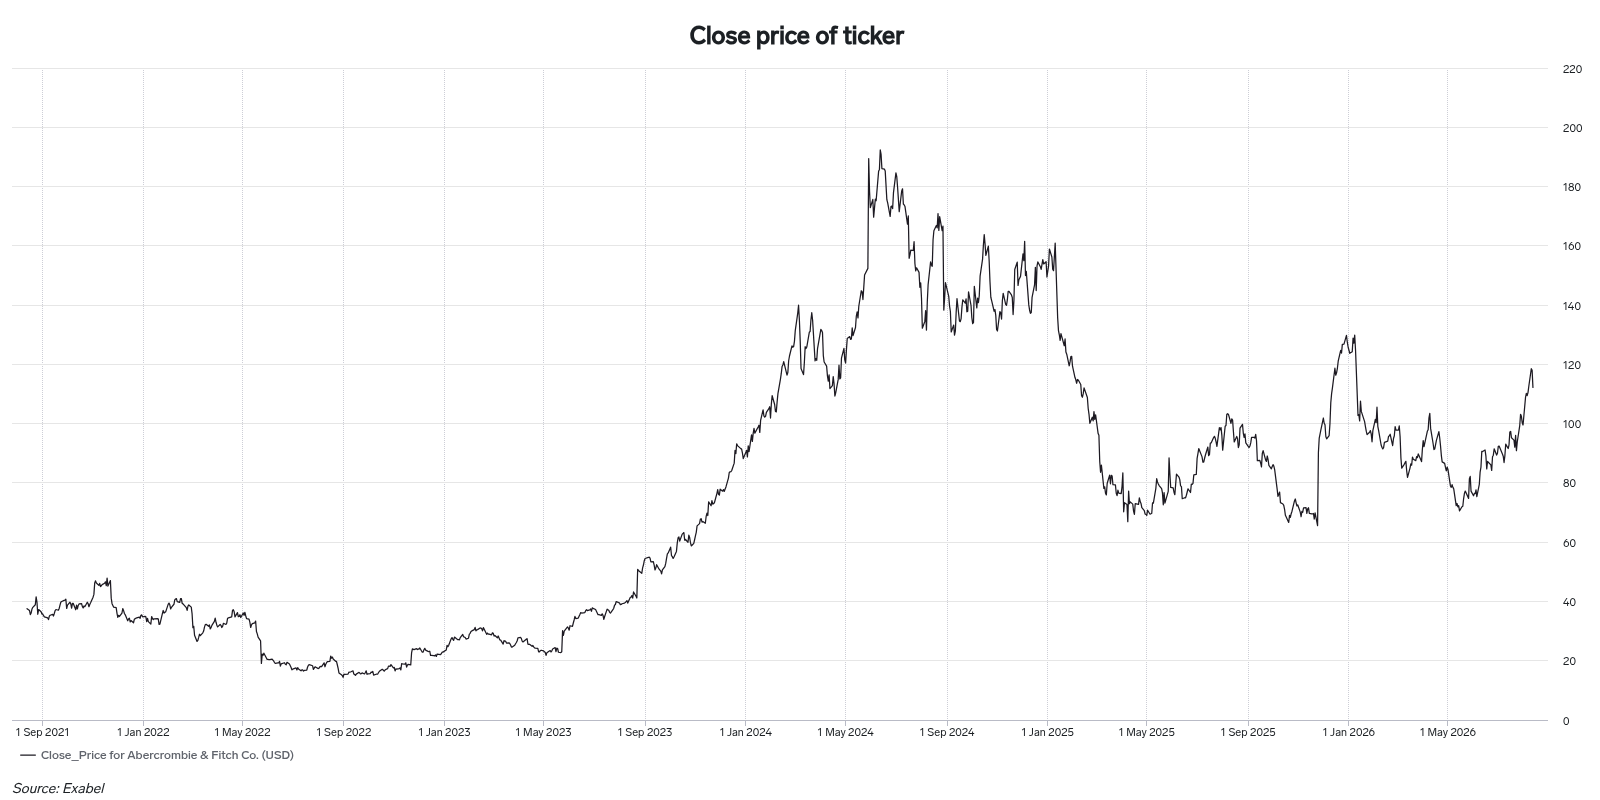
Charts can be rendered as images outside the Exabel web app with the Export chart method (POST /v1/export/chart) in the Export API. The rendered image matches the chart as it appears in the app, using the chart's own saved signals, entities, transforms and appearance settings.
This is useful for embedding Exabel charts in your own research notes, reports or internal tools, and for producing the same chart for many companies without maintaining one chart per company.
Only time series charts are supportedRequests for other chart types — bar, column, pie, cohort and seasonality charts — are rejected with an error.
Finding the chart reference
Every request must name the chart to render, in the chart field. There are two kinds of chart in Exabel, and they are referenced differently:
| Where the chart lives | Resource name | How to find it |
|---|---|---|
| Saved in the Library | charts/123 | Copy the id from the chart's URL in the web app, or look it up with the Management API |
| Built inside a dashboard | dashboards/1234/widgets/1 | List the dashboard's widgets with the Management API |
A chart built inside a dashboard is stored in that dashboard and has no name of its own, so naming the widget is the only way to export it.
The lookup methods below are all in the Management API, which is a separate host (https://management.api.exabel.com) from the Export API (https://export.api.exabel.com) but uses the same credentials.
API key or access token?A customer-level API key operates as the service account user, and therefore only sees folders and library objects shared with the entire customer. To reach charts and dashboards that are private to you, or shared with a smaller group, use a user-level API access token. See Management API Introduction.
Charts stored in the library
Search across all folders with Search for folder items, limiting the result to charts with itemType=CHART:
curl --request GET \
     --url 'https://management.api.exabel.com/v1/folders/-/items:search?query=revenue&itemType=CHART' \
     --header 'accept: application/json' \
--header 'x-api-key: xxx'{
"results": [
{
"item": {
"parent": "folders/45",
"name": "charts/123",
"displayName": "Revenue vs consensus",
"itemType": "CHART"
}
}
],
"nextPageToken": ""
}The name field — charts/123 — is the chart reference. Results are paginated: pass nextPageToken back as pageToken to retrieve the next page (pageSize defaults to 20).
To browse rather than search, list the accessible folders with List folders and then list the charts in a folder with List folder items, again with itemType=CHART:
curl --request GET \
     --url https://management.api.exabel.com/v1/folders \
     --header 'accept: application/json' \
     --header 'x-api-key: xxx'

curl --request GET \
     --url 'https://management.api.exabel.com/v1/folders/45/items?itemType=CHART' \
     --header 'accept: application/json' \
     --header 'x-api-key: xxx'
List folders returns folders without their items, so the second call is always needed. Note that itemType defaults to DERIVED_SIGNAL on List folder items, so it must be set explicitly to get charts.
Charts used in a dashboard
Find the dashboard exactly as above, using itemType=DASHBOARD instead of CHART:
curl --request GET \
     --url 'https://management.api.exabel.com/v1/folders/-/items:search?query=weekly%20review&itemType=DASHBOARD' \
     --header 'accept: application/json' \
     --header 'x-api-key: xxx'
The name field of a dashboard item is dashboards/1234. Pass that id to List dashboard widgets, optionally limiting the result to charts with widgetType=WIDGET_TYPE_CHART:
curl --request GET \
     --url 'https://management.api.exabel.com/v1/dashboards/1234/widgets?widgetType=WIDGET_TYPE_CHART' \
     --header 'accept: application/json' \
--header 'x-api-key: xxx'{
"widgets": [
{
"name": "dashboards/1234/widgets/1",
"displayName": "Revenue vs consensus",
"widgetType": "WIDGET_TYPE_CHART",
"chart": "charts/123"
},
{
"name": "dashboards/1234/widgets/2",
"displayName": "Web visits",
"widgetType": "WIDGET_TYPE_CHART"
}
]
}A dashboard can hold both kinds of chart, and the chart field is what tells them apart:
chartis set — the widget shows a chart saved in the library. It can be exported by either name: the widget name (dashboards/1234/widgets/1) or the chart name (charts/123). Exporting by chart name is usually preferable, since it keeps working if the widget is moved or the dashboard is deleted.chartis empty — the chart is defined inline in the dashboard and has no name of its own. Export it by widget name (dashboards/1234/widgets/2).
Widget ids are only unique within their dashboard, so a widget is always named relative to the dashboard holding it.
If a widget has chartNotFound: true, the saved chart it points to has been deleted or is no longer shared with you. The widget still appears in the dashboard, reporting the chart as missing, but it cannot be exported.
Rendering the chart
With the reference in hand, POST it to the Export API:
curl --request POST \
     --url https://export.api.exabel.com/v1/export/chart \
     --header 'x-api-key: xxx' \
     --header 'content-type: application/json' \
     --data '{"chart": "charts/123"}' \
     --output chart.png
The response body is the image itself (image/png), not JSON. The result is the chart as it appears in the web app:
Parameters
| Parameter | Notes |
|---|---|
chart | Required. The chart to render: charts/123 for a saved chart, or dashboards/1234/widgets/1 for a chart widget in a dashboard. |
entities | Entity resource names to render the chart for. If empty, the entities saved with the chart are used. If provided, they replace the saved entities for every signal group in the chart. At most 100 entities. |
timeRange | An absolute from/to window, as timestamps. If empty, the chart's own saved time range is used. |
version | Point-in-time at which to retrieve the data. Only data with a known-time on or before version is used. Defaults to the end of time. |
format | Image format. png (the default) is currently the only option. |
width | Image width in pixels, 100–4000. Defaults to 1600, matching the web app's own chart download. |
height | Image height in pixels, 100–4000. Defaults to 800, matching the web app's own chart download. |
Rendering one chart for many companies
Because entities overrides the entities the chart was saved with, a single saved chart works as a reusable template — one chart definition rendered for any number of companies, without editing it:
import requests

CHART = "charts/123"
COMPANIES = {
    "AAPL": "entityTypes/company/entities/F_000C7F-E",
    "MSFT": "entityTypes/company/entities/F_00BDMQ-E",
}

for ticker, entity in COMPANIES.items():
    response = requests.post(
        "https://export.api.exabel.com/v1/export/chart",
        headers={"x-api-key": "xxx"},
        json={"chart": CHART, "entities": [entity]},
    )
    response.raise_for_status()
    with open(f"{ticker}.png", "wb") as file:
        file.write(response.content)
Fixing the time range
If the chart was saved with a relative time range, such as the last twelve months, that range is resolved when the request is made, not when the chart was saved. Two requests made on different days therefore return different windows.
To render a fixed, reproducible window — for a report that should not change when it is regenerated — provide an absolute timeRange:
{
  "chart": "charts/123",
  "timeRange": {
    "from": "2024-01-01T00:00:00Z",
    "to": "2024-12-31T00:00:00Z"
  },
  "version": "2025-01-01T00:00:00Z"
}
Combining timeRange with version pins both the window shown and the data used to draw it, so the same request returns the same image whenever it is run.
Updated 2 months ago